BRITISH 2yo RACING
Market Moves & Trainer Types
|
|
BRITISH 2yo RACING Market Moves & Trainer Types |
|
|
Article 15_003_1
7th January, 2015 |
A short article to bring the story of Market Moves grouped by Trainers up to the end of 2014. In 2012 two articles were published on the website, one which covered shortening Market prices ("Supports") and another dealing with lengthening Market prices ("Drifts"). The background to this work was to produce some real data with which to attack the Pundits' (TV, press, betting shop, etc., etc.) fantasy belief in the overwhelming predictive power of the Market in individual cases and even for minor moves (rather than admitting they have nothing worthwhile to say). The childish proposition of the Pundit is that any price shortening indicates the great, mystical 'They' have arranged for this horse to win and any price lengthening that 'They' know this horse is going to lose. This nonsense from the Pundit is never backed up by any evidence so the only way to gain some was for a 'Market denier' to go away and look at the data themselves.
The 2012 articles covered noted Supports & Drifts in the 2010 and 2011 seasons and covered 2,481 'Supported' 2yos and 1,820 'Drifters'. The results produced a mixed story with the Market entirely clueless about many trainers, hints of a signal with some trainers but on only one of Supports or Drifts and a small set of trainers where there seemed to be real knowledge about their 2yos chances in races. A typical situation whereby if the Pundits did a small amount of work they would have a 'Market Tool' which they could waffle on about in more depth, and more usefully, than they did at the time and still do. The sample sizes for many trainers across the 2011-12 period was small which meant making definitive conclusions would be very suspect.
Which brings us to early 2015 and the work was extended to include the data from 2012 to 2014 and produce a complete set of five years covering 2010 to 2015. The number of 'Supports' is now at 8,977 individual 2yos and the 'Drifts' at 6,534. For the combined total of both Richard Hannons this amounts to 748 Supported 2yos and 626 Drifters. The sample sizes for the larger stables now getting to interesting levels without being 'enough' in any worthwhile statistical terms. But, a useful sample to at least start to look at the issue and see if any trends which seem to appear from the data are worth investigating further.
The following two Sections cover one method for categorising the Trainers and putting them in rough Groups. Section 2 giving the background to the method and then Section 3 giving some examples of trainers who, at present, fit into each of the 4 Groups. The final Section gives details of when and how the full Data for each trainer will be published. Then anyone can look at where each Trainer seems to fit and perhaps vary their 'Pundit Lite' babble in respect of some evidence. Or, even better, be encouraged to go and do a larger scale Study themselves, and freely publish it. No breath being held.
The following Scattergram shows the Return on Investment (ROI) for backing all noted 'Support' 2yos for each Trainer on the horizontal (x) axis plotted against the ROI for backing the Trainer's 2yos noted as 'Drifts' in the Betting Market on the vertical (y) axis. Note that the maximum value for losses (negative ROI values) is -1.0. This equates to losing 100% of the money staked on a particular Trainer combined with either their Supported or Drifting 2yos. The Chart has space for values greater than -1.0 for the sake of visual clarity only. The positive figures for ROI can extend to any reasonable positive value. The highest 'outlier' figures tend to be for small trainers who have had a long priced win among a small number of noted 2yos. The highest figure was a trainer Lucy Normile who had an 80/1 winner with her single noted 2yo and an ROI of 80.0. These higher outliers have been left out of the graph so that the most interesting part centred around the (0,0) point is more clearly visible.
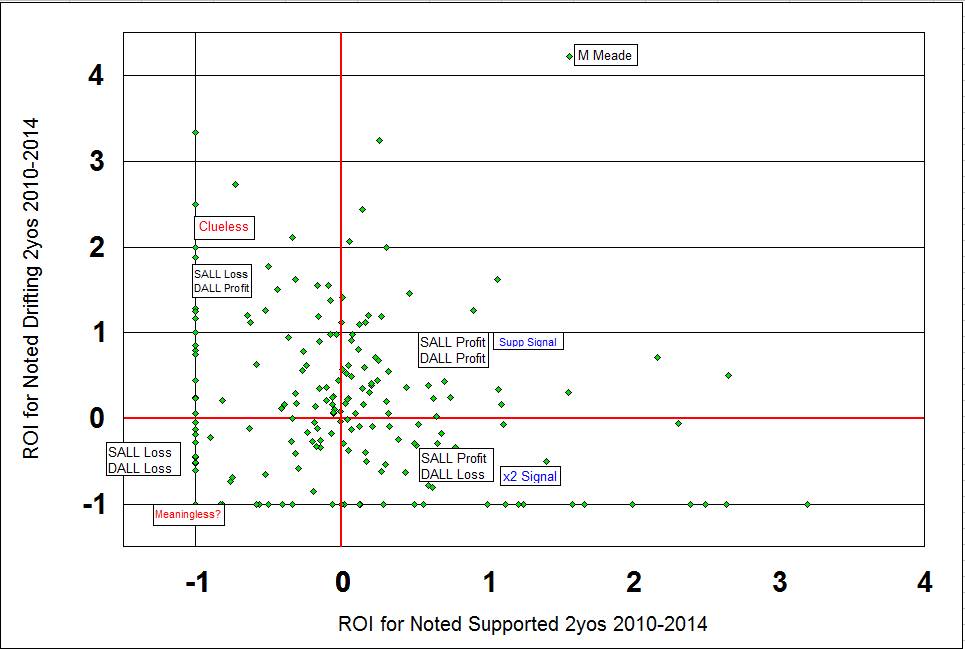
The x & y axes have been coloured red in the scattergram and break the whole area up into 4 different Trainer Types with respect to the Market's possible knowledge. These are the quadrants which will be termed Top Right, Bottom Right, Bottom Left and Top Left. If we took the Pundits' fantasy proposition of all Market Moves carrying worthwhile information (signal), rather than noise, then how would the green diamonds be distributed? They would fit in the Bottom Right Quadrant and be in a close cluster near to the -1.0 horizontal line and spread a little along that line to the right indicating the solid profits backing supported 2yos. How does the real distribution match that hypothesis?
The actual distribution of Trainers' green diamond indicators is widespread around the cental (0,0) point where the two red axes cross. The trainers are spread out around all four types and into most areas in each quadrant. There is as much evidence of Market cluelessness as there is of Market knowledge. The real system looks nothing like that which the Pundits pretend it to be. The question to try to answer is whether there are any useful signals for individual trainers hidden amongst the randomness.
Let us start our description of the Four Quadrants with the Bottom Right which is below the Horizontal Red Line and to the right of the Vertical Red Line. In this Quadrant backing all of the the noted Supported 2yos produces a Profit at Starting Price (SP) and backing all of the noted Drifters produces a loss at SP. This is the 'magic' area that Pundits want all trainers to live in. Where you can try to make a case that all Market Moves, in or out, represent directed influence driven by insider knowledge about the horse's ability and how well it will be allowed to perform on the day. There are trainers in that Quadrant but no more than any other and how much of that is random noise masquerading and something meaningful? Looking at the trainer's individual record is necessary at that point to try to make progress.
Before moving on an important point to note is the real difference between 'Support' type Moves and 'Drifting'. There are many more ways to lose in any race than to win. Which suggests that we should take more notice when supported horses win than when drifting horses lose. It is easy to lose in any race and we should ask how much a losing record with Drifters is any different from what we would see with overmatched horses in any set of races? Also, a poor trainer who does not get the wins they should with their horses can easily produce a 100% loss backing all their Drifters while ZERO worthwhile training nous is involved.
Next let us conside the Top Right Quadrant. This represent the area where backing all of a trainers Supported 2yos has produced a profit, but so has betting on all of their Drifters. In some cases the returns will be better on the Drifters. If we start with the Drifters then how do you make a profit on backing all of them for some trainers? If it is so much easier to lose then how do you ever get bulk wins on Drifters? The answer to that seems to be a mix of the Market knowing nothing and good trainers. You could suggest that with some trainers the Market knows nothing and reacts to unfounded information or perhaps gets into a feedback loop with no positive information available to break out. You then have well prepared horses representing good trainers starting at SPs which do not reflect their chance. If you look through the trainers with larger strings in this section then you could probably split them into two sub-types. Firstly, those where the Supported 2yo Profit displays some insider push but the Drifters are undirected. Secondly, those where the Market receives very little, or no, worhtwhile information and you are just looking at the results a good trainer, with a high Strike Rate, will often turn out.
Move across to the Top Left Quadrant and any Pundit should be ashamed to use a Market Move as a idle crutch to fill time if they have not tried to understand why there are any representatives in that part. This is where the Market Moves have demonstrated they are entirely useless in imparting any knowledge about the chances of a trainer's juveniles. In this Quadrant backing the Supported horses has produced a loss and betting on all of the Drifters has produced a Profit. That just cannot happen in Pundit Land. But there are plenty of trainers in that Quadrant including some of the most important. Perhaps a Pundit would like to explain what is going? Rather than standing before us spouting piffle like "...oh, Aimless Wandering has come in to 8/1 from 10/1 so the connections must fancy it.... ". Berks.
The Bottom Left Hand Quadrant contains those trainers with whom you would have made a loss by backing on all ther Supported and Drifting 2yos. If you said that the losses on Drifters was meaningless noise looking like valid signal then another set of trainers where following Market Moves blindly is stupidity. These are trainers where positive signals for their horses rarely mean anything so why would you be bothering with what the Market was saying?
The scattergram below is similar to the one in the previous Section but with some minor changes. A number of the higher ROIs, for trainers in profit, have been removed to make the graph more tightly focussed on the Central region where most trainers reside. Secondly, there are 5 example Trainers noted for each of the four main Trainer Types. These have a two letter Marker close to their green diamond on the Chart and then their fall name in the reference list Box in each Quadrant. It is useful to put real names and characters into the Trainer Type areas to get a feel for what their positioning on the scattergram is actually saying.
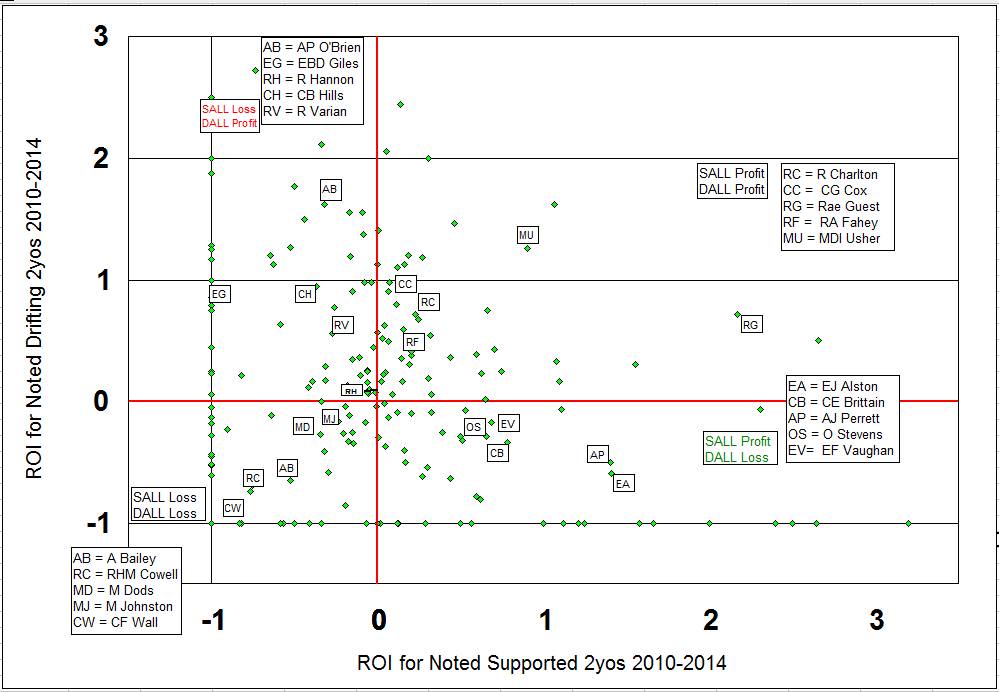
For example, the five trainers listed in the Bottom Right Hand quadrant are those who got some of the biggest profits following their Supported 2yos in 2010-14 allied to losses following all of their Drifters. Surely, you might think, that sort of double result must mean some insider information is flowing into the Market? Are the 5 trainers listed any of the ones you might have picked out as the kind of 'shrewdie' who has definite Market links? Look at them in detail and you would suggest the 5 are different sub-types within the Quadrant. They range from a trainer who has only had a few representatives whose results have fallen that way by chance through to one where the Market does seem to have a good handle on what to expect from their 2yos.
The Top Right Quadrant shows trainers where you would have made a profit backing all their noted Supports 2010-14 at SP and would have made a profit backing all their Drifters. A key question then is how much of the Supports profit is due to a real signal towards the Market? Do the dual profits just reflect the fact that good trainers with high Strike Rates can often get winners with Drifters? Fahey's Strike Rate is around 15%, Charlton's at 17% & Cox was at 14% in 2014. Even if you never consider running some sort of 'System' based on backing Drifters with such trainers the least you need to know is that you should ignore the Market entirely when one of their 2yos starts Drifting. In the Fahey case B2yoR has long had a theory that the Drifter profits come about because so many Northern Maidens are more empty and devoid of worthwhile quality than the Fahey stable imagines.
Move across to the Top left Quadrant and this is the Totally Clueless area for the Market. These trainers' Supported 2yos will net you a Loss if you back them all, while conversely, you can make a profit backing all of their Drifters. In this Quadrant the outcome destroys every shred of possible meaning in the Pundits' Market related words. They are bullshitting as a minimum and tipping into plain lying if they refuse to do some research work themselves. There are a lot of examples in this Quadrant and some of the big names have been chosen to make the point. With Charlie Hills your record with Supported 2yos would have been an ROI of -0.26 at SP and -0.06 at Opening Prices. Those returns based on 22 wins from 146 bets. The record with Drifters was 25 wins from 110 noted 2yos and an ROI of 0.78 (78% profit on turnover). Explain that.
Richard Hannon senior is wedged into the Top Level Quadrant as an example to ensure his name appears as the dominant 2yo training force. But his record over the 3 years 2010-13 is a profit on the Drifters of 0.08 (8% on turnover) and a loss on the Supports of -0.01 at SP. That is based on 574 noted Supports and 469 Drifters. Looking at the records of a number of the bigger Stables and they cluster quite closely around the (0,0) Centre Point. Mick Channon's ROI pair is Supports -0.06 (387 bets) and Drifts +0.08 (281); John Gosden's record is Supports -0.05 (204) and Drifts 0.10 (110); Tom Dascombe's is Support -0.19 (198) and Drifts -0.04 (128). There feels like there might be some message in how some large stables seem to be grouping around the Centre Point. But it is not clear quite what, as yet.
Finally, the Bottom Left Quadrant shows 5 example trainers who you would show a loss on backing any set of their 2yos, Supported or Drifting. Looking at the examples you would not classify any of them as 'poor' trainers so why do their Supported juveniles make losses compared to the good trainers in the Top Right Quadrant? Is there something about those trainers that means the Market misjudges them more often than not? At the anecdotal level, for example, you would say Chris Wall has a reputation as a 'shrewd' trainer who plots up handicap wins with 3yos. But, he isn't much interested in 2yo racing beyond using it to ensure a low handicap mark for his 3yo handicappers, unless he has a natural juvenile like Accipiter in 2014. Do the Market formers fail to put their "..Wall is a plotting shrewdie.." Bluffer's Guideline to one side when assessing his 2yos?
The full Results Data, for both Supports & Drifts, for each trainer will be made available before the start of the 2015 Turf Season. This will consist of an Index Webpage which will be an option to link to under the 'Trainer Resources' drop-down menu on the site Homepage. The pair of Tables and descriptions that follow detail what form the data presentation will take. Feel free to request extra classes of figures or a tweaked format and it will be considered for inclusion in the published Data.
The example trainer chosen here is Clive Brittain, partly to give the Pundits some data to drool over. In the original Market Moves Part 1 document he was used as the first example of a trainer who seemed to show a real link to the Market relating to how his horses ran. With his Supported 2yos showing regular profits if you backed them all and his Market Drifters ony rarely winning and looking like long priced 'accidents' when they did.
That article then went on to be mildly rude about Brittain who has had a remarkable career in many ways, while it still being possible to find a range of shortcomings in his results with 2yos. When thinking about this further the vague memory came back that Brittain started his training career partly with the proceeds from his betting using insider knowledge. When that was "part of the game" rather than an activity which could mean you losing your Training Licence.
The Table below shows his results with all noted Supported 2yos in the period 2010 to 2014. The first line in the Table is the summary for the whole period showing 16 wins from 66 noted Supports and a 66% profit on turnover if you had backed them all at SP. His Strike Rate is a terrific 24% when his record with all aged runners in 2014 was at 6%, for one comparison.
| C. E. BRITTAIN :- 2010-14 SUPPORTS |
||||
| Group | Wins | Runs | Strike Rate |
ROI (Final SP) |
| 2010-14 | 16 | 66 | 24.2% | +0.66 |
| 2010 | 5 | 19 | 26.3% | +0.28 |
| 2011 | 4 | 6 | 66.7% | +3.42 |
| 2012 | 1 | 2 | 50.0% | +1.25 |
| 2013 | 5 | 33 | 15.2% | +0.46 |
| 2014 | 1 | 6 | 16.7% | 0.00 |
| FTOs | 5 | 17 | 29.4% | +0.65 |
| STOs | 4 | 17 | 23.5% | +1.49 |
| SPL4 | 7 | 19 | 36.8% | +0.34 |
| SPG4 | 9 | 47 | 19.1% | +0.79 |
| SCL4 | 5 | 45 | 11.1% | +0.17 |
| SCG4 | 11 | 21 | 52.4% | +1.71 |
The other Lines in the Table above then show the headline data (16/66 at 24% for a ROI at +0.66) broken down by sub-categories. The second block of data showing how the record with Supports went in each individual season of the period 2010-14. It is useful to see, as one point to note, that he gets a profit in 4 of the 5 years and breaks even in 2014 with a small number of Supported 2yos noted. His overall positive result has not been produced by a couple of lucky long priced winners. Instead, it seems steady across the seasons which increases the belief in their being some signal in the Market shortenings.
The rows labelled FTOs & STOs show the results for the just the debut runs in the survey (i.e. First Time Out or FTO), or the second runs (STO). These are sub-sets or samples from the complete data and a third figure for all runs later than STO would complete the set.
The rows labelled SPL4 & SPG4 split the overall data in two depending upon the Final SP. All SPs up to, and including 4/1, make up the 'SPL4' group. All returned SPs above 4/1 are in the 'SPG4' group.
The rows labelled SCL4 & SCG4 split the overall data in two depending upon the percentage change of the SP from opening price to final SP. Smaller changes up to, and including 4% of relative probability, are in the 'SCL4' group. All price changes of 4% and above are in the 'SCG4' group. Note, that these 'change' groups can include SPs of any length since they are about relative changes. In the Clive Brittain example table above note the good and profitable results with the largest Market Moves (the 'SCG4' row). In the previous Study a move of 4% or greater often appeared to be some sort of transition line for a number of trainers.
The Table below shows the same set of information for Clive Brittain's 2yos who were noted as Drifting in the Market during the period 2010 to 2014. The headline figures being very different to the Supports results with 3 wins from 38 noted Drifters returning losses in most categories. The largest Drift for one of his juveniles that won was for Rizeena in 2013 before she won her maiden STO at Ascot. That Drift was at the 4.5% Price Change level.
| C. E. BRITTAIN :- 2010-14 DRIFTS |
||||
| Group | Wins | Runs | Strike Rate |
ROI (Final SP) |
| 2010-14 | 3 | 38 | 7.9% | -0.29 |
| 2010 | 0 | 8 | 0% | -1.00 |
| 2011 | 1 | 9 | 11.1% | +0.89 |
| 2012 | 1 | 3 | 33.3% | +0.83 |
| 2013 | 1 | 14 | 7.1% | -0.68 |
| 2014 | 0 | 4 | 0% | -1.00 |
| FTOs | 0 | 9 | 0% | -1.00 |
| STOs | 1 | 11 | 9.1% | -0.59 |
| SPL4 | 1 | 5 | 20.0% | -0.10 |
| SPG4 | 2 | 33 | 6.1% | -0.32 |
| SCL4 | 2 | 29 | 6.9% | -0.22 |
| SCG4 | 1 | 9 | 11.1% | -0.50 |
It is informative to note that Brittain showed a Profit backing all Drifters in 2011 and 2012 and this is a lesson in Sample Sizes. Start your Study looking at the 2011-12 years only and you would get entirely the wrong message. Those two wins were in weak maidens at Beverley (16/1 on 3TO) & Yarmouth (9/2 on 5TO) by lesser types who happened to find a poor race to win. The Drifting presumably just indicating that Brittain thought his 2yos were below average Open Maiden winner standard and did not know the quality of the opposition on the day. But the Big Lessen to learn is never rely on 'Trends' which appear based on small sets of Data. The Trends are almost certainly Random and will disappear in short order over the next accounting period. Even the Sample Sizes in this 5 year Study Data Set are not enough to be confident in coming to strong conclusions. In Life data is always incomplete and analysing it work-in-progress.
[Aside = Finding examples of 'Statistics' being used incorrectly is toweringly easy to find. Even Stats Geeks need to approach a largely counter-intuitive subject with great caution and be circumspect with what they feel they can assert following any work. This article was written at a time when a peer-reviewed paper into how much Randomness there was in the chances of getting some form of Cancer across a whole population (and inapplicable in individual cases) was published.
The figure which got widely reported was that 66% of Cancer cases are just Random and asking a "Why me?" question after a positive diagnosis in those cases would be opening a search for no cause. Beyond the fact that your body makes a few errors in copying your monstrously long DNA code, and associated flags & markers, during the super-Astronomical number of times cell division occurs in your body. The older you are the more times that process of copying has had to get something wrong. Soon after the paper was reported then examples of Stats savvy people filleting the Study, and the associated reporting, appeared. Here is one example by David Spiegelhalter
Almost resisted putting in a Racing related example to make the point about "easy to find invalid use of Stats", but failed. Here is Timeform Head of Research - Simon Rowlands - wasting everyones' time by suggesting the sample sizes in his Study (the 'Count' figures in his Tables) mean anything worthwhile. A Stats Geek would shred it and throw it away. Hang on though, Rowlands is a Stats Geek, surely? He blathers on about Bayes Theory and gives talks on the subject. Why produce stuff like that article and claim it was meaningful in directing a person's betting over the winter? Except because you had to do something. Everyone is prone to Stats errors, from Nobel Laureates and onwards. Oh, and good to see the Rowlands article make such a song-and-dance about following progeny of the sire Fasliyev. That sire was exported to Japan for the 2009 season and has very few runners left in Britain. A further reminder that in horse racing you are often trying to find trends in a constantly changing Story and data set. ]