|
|
If you follow 2yo racing at all the received wisdom that the topweights in nurseries are where to look for the winners will not be a new concept to you. For example, it will be used regularly by racing's pundits, usually after the topweight has won the previous race in a blatant piece of selective 'positive confirmation' (of the speaker's viewpoint). But how much value is there in this advice? Do topweights actually win the majority of nurseries and is it profitable to support them?
This article reports on a relatively simple analysis of the results of the 134 nursery races run in Britain in 2006 during the turf season (March 19th to November 4th). While not a large sample a season's worth of results ought to be enough to start getting a feel for whether there is something in the saying. It is a 'simple' analysis because it soon became clear that to investigate the nursery results in depth would require a large amount of work.
Before getting into the details it is worth mentioning an (irritating) point which gets brought into Official Ratings discussions, often by trainers and analysts. The 'Topweight' in a race is the horse carrying the highest weight and sets the RELATIVE disadvantage it has with horses carrying less weight than they are (typically in the range 1lb to 23lbs for 2yos in the current set-up of a 9 stone 7lbs to 7 stone 12lbs range).
In the simplest view it does not matter whether that topweight is 10 stones (140lbs) or 7 stones (98lbs), for example, so long as a horse judged 10lbs inferior to the actual topweight carries that much less. You will often hear it said that 'this horse is/isn't (delete as required) built for carrying big weights in handicaps......' as if the actual weight carried matters most rather than the relative weight differences to it's opponents. If trainers and pundits actually believe this to be the case can they please supplement the use of the trite phrasings with their findings on the non-linearity of the effects of weight carried on horse performance. It would be fascinating for everyone to know why carrying 10lbs more than your opponent matters more if you start with 10 stone rather than 7 stone.
Ahem, let's quickly move on to the findings.....
During the 2006 turf season there were 134 nurseries run between July 2nd and November 4th. The number of 2yo races run in the whole season was 960 so that nurseries account for around 14% of juvenile events (about 1 in 7 races). The first nursery in 2006 was the 255th juvenile race and nurseries therefore make up just under 20% of the races from July 2nd onwards.
There were 163 horses that ran as topweights (including multiples in one race) and 25 of these won at a strike rate of 15.33%. The overall figure for all runners in nurseries (including those topweights) is 1,403 runners and 134 winners at a strike rate of 9.55%. As a starting point a solid indication that the topweights compete better than the overall average.
The following table summarises those 134 nurseries
split by the number of topweights in the event. For example, 111 of the
nurseries had a single horse carrying topweights, 18 had joint topweights,
etc. Note that the abbreviation 'T/w' is used for 'Topweight' & S.P.
is 'Starting Price' with all winners assumed to have been backed at S.P.
| Number of T/ws | Number of Races | Total number of
horses (i.e. bets) |
Number of Wins
(% wins) |
Total S.P. of winners | Level Stakes
Profit/Loss |
| 1 (Single horse) | 112 | 112 | 16 (14.3%) | 66.3 | -29.70 |
| 2 (Joint t/ws) | 18 | 36 | 7 (19.4%) | 59.0 | +30.00 |
| 3 | 2 | 6 | 0 | - | -6.00 |
| 4 | 1 | 4 | 1 (100%) | 12 | +9.00 |
| 5 | 1 | 5 | 1 (100%) | 3.3 | -0.70 |
| TOTALS :- | 134 | 163 | 25 (15.3%) | 140.6 | +2.6 |
The 'TOTALS:-' line in the table therefore summarises the results if you had had a single point level stake bet (at S.P.) on every topweight (including joint- and co-topweights) during the season. The number in the final cell of +2.6 says that blindly betting on every topweight would have produced a small profit. This 'feels' like an interesting result for a such a blunt, simple System.
In statistical analysis terms the sample size (i.e. 134 races) isn't big enough to conclusively prove long term profitability. The individual profit/loss results for different numbers of topweights in the race would certainly vary greatly with different sample races. For example, the large profit for joint topweights in 2006 is most unlikely to be a long term effect and just an artefact of how the results fell in 2006. Looking at the 7 winners in that category there's no obvious underlying link - they are spread across the season, race distances, etc.
However, anyone who was going to invest their time, effort & money in following topweights would expect to be able to better S.P. across a set of wagers. Along with the small profit figure for S.P. bets this means the 2006 results give encouragement to look further into the details to see if the system of 'Backing the topweight' can be usefully refined. The next section takes a shallow delve into those possible refinements.
There are a wide range of individual factors, and their combinations, that could be looked at to see if they could improve the success rate of betting on topweights. This section considers only two of those, later the effect of whether topweights were previous winners but firstly - Does Race Class affect the results?
The Classification of races has been tweaked and
fiddled with regularly in recent years - remember we have had A-E classes
reformulated as A-H and currently they are termed 1-7 (with Letters and
monetary values as sub-divisions if you really want to go that far). But,
in Nursery terms the least we need to know is :-
| Race Class | Ratings Range | Number Of Races | Number of T/ws | T/w Winners
(% win) |
Total S.P. | Level Stakes
Profit/Loss |
| 2 | up to 110 | 14 | 16 | 2 (12.4%) | 24.5 | +10.50 |
| 3 | 76-95 | 14 | 15 | 3 (20.0%) | 20.5 | +8.50 |
| 4 | 66-85 | 46 | 55 | 10 (18.2%) | 36.7 | -8.30 |
| 5 | 56-75 | 46 | 59 | 10 (17.0%) | 58.9 | +9.90 |
| 6 | 46-65 | 14 | 18 | 0 | - | -18.00 |
Hmm, an interesting final column and an apparently easy conclusion to draw - leave off betting in the lowest Class of nursery races and your mild profit turns into real good returns. I can already hear the trained statisticians groaning and muttering, and with good reason. 14 races is too small a sample to draw a definite conclusion - in 2007 it would only take a 33/1 shot with topweight to blunder into a, draw bias assisted, victory in an appalling Class 6 and a couple of short-head photographs in Class 2 nurseries to go the wrong way to turn that final column upside-down. Which is why we really need hundreds of races in each column to ensure that a few results don't change the outcome entirely.
But we do need to take a pragmatic view as well - we aren't growing wheat in a field and able to choose how many tens-of-thousands of samples we can 'plant' and assess. We have around 140 races a year and the other 'variables' in the system - trainers, race classes, etc. will vary over a period so we can never produce an ideal set of data. We have to make some decisions based on the information we have.
Let's start by looking at how the topweights in those
Class 6 events actually performed. Only 5 of the 18 made the first 3 -
three were runners-up and two thirds which doesn't suggest they competed
strongly as a group. But again we need to beware because the 16 topweights
in Class 2 races only managed two places aside from the two wins.
Perhaps more telling is if we split the topweights in Class 2 and Class
6 events by their previous performances :-
| Previous Winner | Previous Seller Winner | Maiden as T/w | |
| CLASS 2 | 16 | 0 | 0 |
| CLASS 6 | 3 | 4 | 11 |
So, all 16 of the topweights in the Class 2 events were previous winners and were often beaten because their form was over-rated or because they were rated correctly but against progressive opponents. However, they have demonstrated real ability and will include a small number that can develop and win even as topweights. The two winners in this group in 2006 were :-
The previous section was a brief review of the effect of Race Class and Previous Winning Performances as factors that affect the overall performance of a group of topweights. There are a range of other factors by which the data can be broken down and to do an extensive study would be a large undertaking. Before listing some other possible factors let us consider whether time of year makes any difference. Since the juvenile handicap starts afresh each year it is not difficult to imagine that the Nursery races change in competitiveness as more horses move into handicap racing, the ratings are refined with the handicapper having more individual runs to assess, longer distance races become more prevalent, and so on.
The following table gives the details for splitting
the races by month, a somewhat arbitary period but we need to start somewhere.
| Month | Total Races | Total T/ws | Wins | Total Win S.P. | Level Stake
Profit/Loss |
Av. WLT/w
of Winners |
| JULY | 20 | 22 | 4 (20.0%) | 20.5 | +2.5 | 9.35 |
| AUGUST | 38 | 39 | 9 (23.7%) | 28.3 | -1.7 | 8.11 |
| SEPTEMBER | 45 | 60 | 10 (22.2%) | 74.3 | +24.3 | 6.13 |
| OCTOBER | 25 | 35 | 1 (4.0%) | 5.5 | -28.5 | 5.08 |
| NOVEMBER | 6 | 7 | 1 (16.7%) | 12.0 | +6.0 | 4.67 |
As ever there is the caveat about the small number of races in the sample but it is not easy to see a pattern in the figures. What could be the possible reasons for the very profitable September and the poor October? Are they 'real' and likely to show up again in 2007? One possible explanation is that, if you recall, we had a very wet October following on from a warm summer. Did the change from Good-to-Firm going to Soft (or often worse) in October mean that the form and ratings built up on faster going got drowned out - literally - and produced more surprise winners from lower in the handicap?
The final, cryptically titled, column in the table provides some indication of where in the handicap winners came from in each month. The title is short for "Average Weight Less Than The Topweight carried by the [month's] Winners". So in July the weight in lbs less than the topweight that each winner carried (i.e. zero for a topweighted winner) is totalled and then divided by 22 to get the average. The figures do not give much clue as to what the difference between September and October was in 2006. However, it is fascinating to see the figure decrease month-by-month so that November is half that of July. If this is a real effect then what underlying process is causing it?
At which point it is probably a good time to stop because you will be getting that message that the more you hold this Nursery Topweight thing up to the light the more facets it has. For example you could include the following, non-exhaustive, list of factors into the analysis :-
Back to TOP of PageRace Distance (perhaps by time of year, etc) Going Actual weight carried (i.e. does Absolute weight carried matter as touched on in section 1?) Finishing position on the last outing of winners (links to Race Class, etc) Run number (e.g. do Topweights on their fourth outing do better than on later runs?) Difference in Official Rating compared to last outing (e.g. is it better to back topweights with rising ratings or falling?) Does gender make a difference?
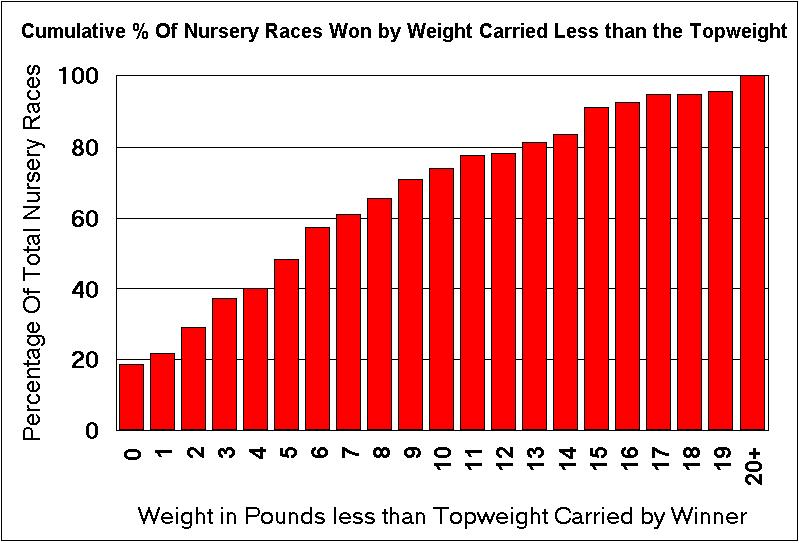
The previous sections have concentrated on the performance
of topweights in nurseries but how does the performance of lower weights
vary? The chart below shows the cumulative percentage of Nursery
races won on the Y-Axis plotted against the number of pounds (lbs) less
than the topweight carried by the winner. Therefore, the bar above the
Zero records the percentage of Nursery races won by topweights in 2006
(remember that the overall strike rate is 15.3% but this equates to more
than 18% of the actual nursery races because of multiple topweights in
races).
Looking at the chart we can see that close to 50% of all races are won by horses within 5lbs of the topweight and two-thirds within 9lbs. A relatively small number of races are won by horses carrying more than 14lbs less than the topweight and the reasons for the successes of this lowly weighted horses could be an article in it's own right.
The earlier sections have looked at the data for 2006 to see whether any case can be made for topweights being unusually successful in nurseries. While further work would be needed it was the case in 2006 that no harm would have come to you if you had backed all the topweights without thinking. Also, you could have done quite nicely if your betting could have cut out some of the obviously poorer value topweights (e.g. maidens in lower class nurseries).
If handicapping were a precise science, horses 100% consistent and unimprovable while also being immune to external factors such as going and distance then there's no reason to expect topweights to do relatively well. We would see winners come along at the same strike rate from all areas of the weight range. Why should topweights perform better than the average at all?
On the Racing UK coverage from Nottingham during the summer the Racing Post's James Willoughby came quite close to saying something useful in this context (before, as often is the case, paying more attention to the comedy act...). Either Love Brothers or Everymanforhimself had just won the nursery as topweight and the question had been posed as to why topweights should generally compete well. Mr Willoughby responded that "...the handicaps are compressed [in nurseries] so that the topweights have a relative advantage...". He did not have time to explain what he meant by 'compressed', nor why this should occur, before moving on.
So, let us set aside all other considerations initially and just focus on one area - the handicapper and his motivations. The handicapper has in his mind that he should be allocating the absolutely correct weight to every horse but he knows that he will have limited evidence with juveniles. He's even more worried about not letting anyone get away with anything than he is with getting it absolutely right. This means he errs on the side of over-rating 2yos at the first hint of ability. This is covered in greater depth in an Article on this site. Therefore, from the start of the handicaps there are a high percentage of horses that are too high in the handicap but they will only come down in small steps (1lb to 2lb per poor run typically). This is one factor in the 'compression' of the handicap with lower quality horses shunted too high. This includes early season form which is generally over-rated and only those 2yos with real physical scope to progress will compete well in nurseries.
At the other end of the scale the 'Race Standardisation' mind-set of the handicapper means that he is loathe to rate horses above 90 that have not run in Listed or Group races. This area is for horses that have proved themselves in 'superior races' no matter how poor the quality of that race in actual performance terms. The 85-90 range also tends to be kept for runners who have run in Conditions races and Novice races at better courses. So we now have a ceiling against which ratings run up against and will not get breached for 2yos who steer clear of the 'wrong' races.
[Aside - If you want to get a feel for what the 'Race Standardisation' thinking can do then take a look at this result for the 2006 Queen Mary - Result. Remember this race is run before the nurseries start but it is a 'top class' fillies race and runners in it have to be rated accordingly. It is a somewhat baffling result with Group 1 winner Simply Perfect (2nd) and later Listed winner Vital Statistics (6th) sandwiching some pretty minor talents. It is explainable and if you do so it answers a lot of questions about how 2yo racing (& trainers) work. But consider that the third Nina Blini ran unplaced in nurseries on her next two runs off 95 & 92. The fourth - Sparkling Eyes - ran in six later races with her OR declining from 95 to 76, the fifth in Slipasearcher declined from 92 to 77 during the season and is currently eating too much dust on the AW over the winter. The seventh home couldn't place off 79. All this was very obvious, and predictable, if you looked at the fillies as physical specimens in June but the official handicapper just couldn't bring himself to give the "QUEEN MARY" the low rating it deserved.]
This, B2yoR suspects, is the other factor in the 'compression' - the top down push against which the rating inflation presses. We now have the majority of competitive 2yos (at Class 5 upwards) in the range 65-80 (or 85). This quite narrow range will include everything from small early season runarounds with no improvement in them to slower developing types with good scope to improve.
A key point to understand, for trainers as well as the rest of us, is that a 2yo needs to start in handicaps with a usuable Official Rating. Once it is into the system it will follow normal handicapping lore. Increases for anything other than blatantly impressive wins and runs will be in the 1lb to 7lb range and decreases will come slowly and grudgingly in small portions. The reasonable increases and the compressed range mean that horses with potential can become the the competitive topweights as they rise in the system. B2yoR has no evidence but the handicapper does seem to set Official Ratings so that winners and progressive horses are not just above the levels of rating ranges for classes. For example a minor maiden winner will end up rated 75 (rather than 76) so that they are able to become the topweights in Class 5 rather than the bottom of Class 4.