| << Stats Home | Horses | Races | Winners |
|
Sire/Dam - General | Trainers - General |
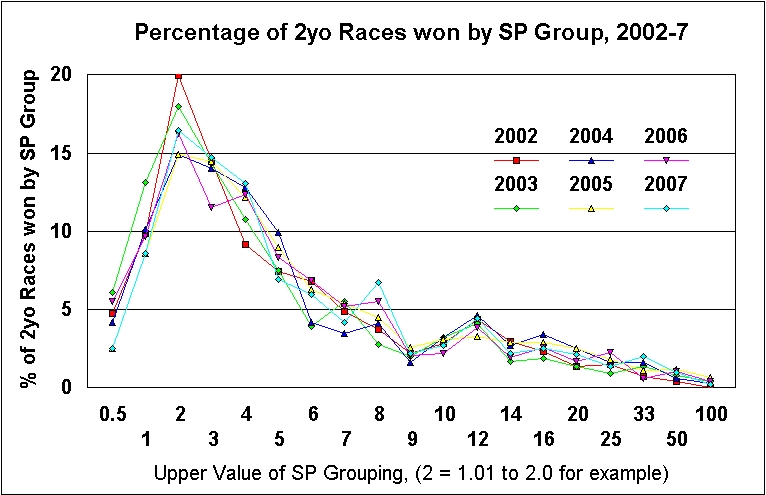
The following chart shows what percentage of 2yo races were won by each SP range in each of the seasons 2002-2007.
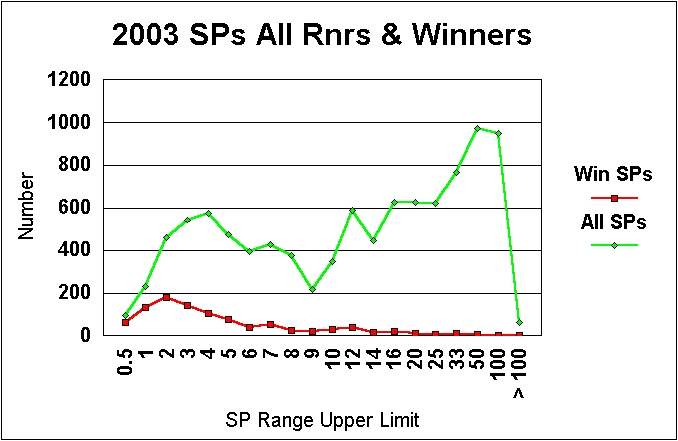
The following graph shows an example of the total number of runners (green line) within a particular SP range and the number of those that won (red line) for the 2003 season
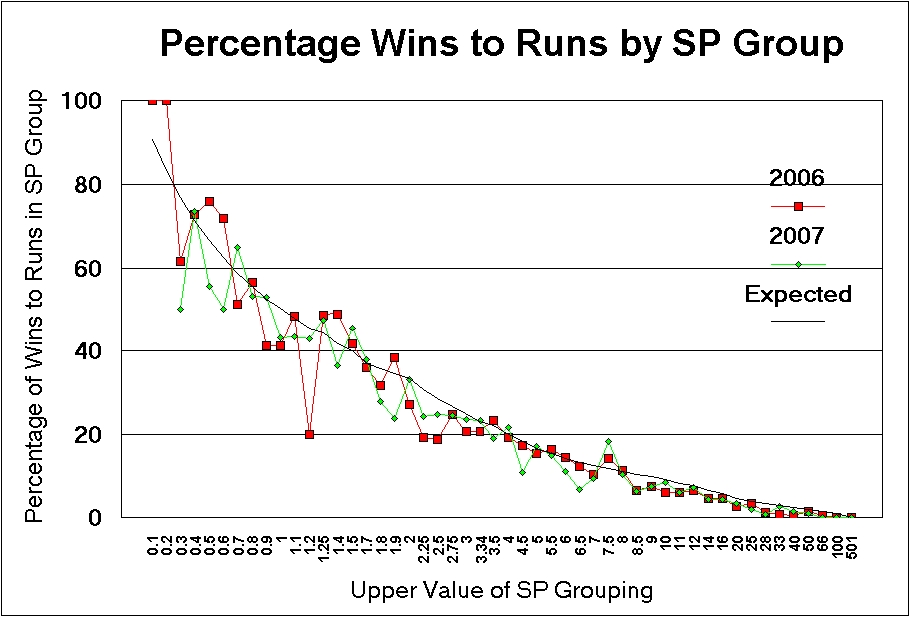
The solid black line in the two charts below shows the expected wins-runs percentage for each SP range. The SP ranges are represented as decimal numbers. Where the variable data lines are above the black 'expected' line it shows that the 2yo runners within that SP range won more races than the chance suggested by their Starting Price in that season.. If the coloured lines are below the black line then the 2yo runners with that SP have been less successful as a group than their SPs would suggest.
The first chart covers the four years 2002 to 2005 and the second, larger chart, the two years 2006-7.
Of interest has been the range 0.5 (i.e. 1/2) through to 1.25 (i.e. 5/4) which have shown a good set of examples of SP ranges exceeding expectations in the last six seasons. It is worth remembering that these are against returned SP figures. With the current competitive betting market, including Internet Exchanges, it would be normal to expect to be able to better the final SP for the majority of individual examples in each group.
Chart 1 : Seasons 2002 to 2005
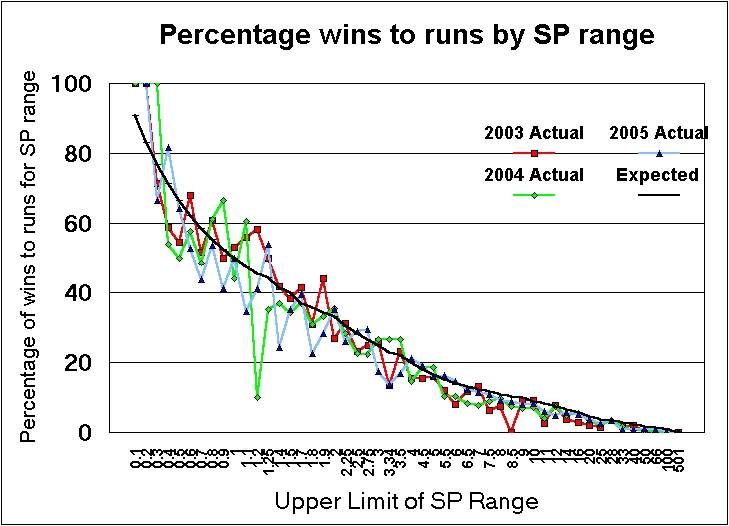
Chart 2 : Seasons 2006 to 2007
The following tables show the average Level Stakes Loss (and occasional
Level Stakes Profile) for all 2yo runners split by the run number (where
FTO = first time out, STO = second time out, 3TO = third time out, etc.)
The three tables are for the 2003-2005 seasons.
| 2003
Season |
Total Runs | Total Wins | Win Percentage | Total SP of winners | LSP/LSL in SP Range | LSP/LSL per Runner |
| FTO | 2,647 | 169 | 6.4% | 1473 | -1005 | -0.38 |
| STO | 2,167 | 269 | 12.4% | 1455 | -443 | -0.20 |
| 3TO | 1,640 | 213 | 13% | 919 | -508 | -0.31 |
| 4TO | 1,083 | 126 | 11.6% | 714 | -243 | -0.22 |
| 5TO | 766 | 90 | 11.7% | 388 | -288 | -0.38 |
| 6TO | 504 | 44 | 8.7% | 250 | -210 | -0.42 |
| 7TO | 352 | 22 | 6.3% | 119 | -211 | -0.60 |
| 8TO | 233 | 23 | 9.9% | 171 | -39 | -0.17 |
| 9TO | 153 | 13 | 8.5% | 114 | -26 | -0.17 |
| 10TO | 104 | 14 | 13.5% | 74 | -16 | -0.15 |
| 11TO | 73 | 4 | 5.5% | 21 | -48 | -0.66 |
| 12TO | 47 | 6 | 12.8% | 70 | +29 | +0.62 |
| 13TO | 25 | 3 | 12% | 10 | -12 | -0.48 |
| 14TO | 18 | 1 | 5.6% | 4.5 | -13.5 | -0.75 |
| 9,812 runs |
|
| 2004
Season |
Total Runs | Total Wins | Win Percentage | Total SP of winners | LSP/LSL in SP Range | LSP/LSL per Runner |
| FTO | 2,912 | 184 | 6.3% | 1648 | -1080 | -0.37 |
| STO | 2,362 | 272 | 11.5% | 1299 | -791 | -0.33 |
| 3TO | 1,821 | 190 | 10.4% | 1032 | -599 | -0.33 |
| 4TO | 1,258 | 140 | 11.1% | 954 | -164 | -0.13 |
| 5TO | 809 | 74 | 9.1% | 548 | -187 | -0.23 |
| 6TO | 548 | 52 | 9.5% | 287 | -209 | -0.38 |
| 7TO | 347 | 34 | 9.8% | 213 | -100 | -0.29 |
| 8TO | 217 | 20 | 9.2% | 134 | -63 | -0.29 |
| 9TO | 128 | 19 | 14.8% | 150 | +41 | +0.32 |
| 10TO | 80 | 7 | 8.8% | 51 | -22 | -0.28 |
| 11TO | 42 | 3 | 7.1% | 15.5 | -23.5 | -0.56 |
| 12TO | 22 | 1 | 4.5% | 5.5 | -15.5 | -0.70 |
| 13TO | 14 | 1 | 7.1% | 2.25 | -10.5 | -0.75 |
| 14TO | 3 | 0 | 0% | 0 | -3 | -1.00 |
| 10567 runs |
|
| 2005
Season |
Total Runs | Total Wins | Win % | Total SP of winners | LSP/LSL in SP Range | LSP/LSL per Runner |
| FTO | 2,904 | 173 | 6.0% | 1670 | -1061 | -0.37 |
| STO | 2,356 | 270 | 11.5% | 1818 | -268 | -0.11 |
| 3TO | 1,834 | 193 | 10.5% | 1102 | -539 | -0.29 |
| 4TO | 1,199 | 137 | 11.4% | 781 | -281 | -0.23 |
| 5TO | 801 | 83 | 10.4% | 450 | -268 | -0.33 |
| 6TO | 562 | 64 | 11.4% | 498 | 0 | 0 |
| 7TO | 359 | 37 | 10.3% | 223 | -99 | -0.28 |
| 8TO | 218 | 20 | 9.2% | 102 | -96 | -0.44 |
| 9TO | 148 | 7 | 4.7% | 46 | -95 | -0.64 |
| 10TO | 95 | 9 | 9.5% | 82 | -4 | -0.04 |
| 11TO | 62 | 4 | 6.4% | 40 | -18 | -0.29 |
| 12TO | 30 | 2 | 6.7% | 11 | -17 | -0.57 |
| 13TO | 15 | 0 | 0% | 0 | -15 | -1.0 |
| 14TO | 9 | 1 | 11.1% | 20 | +12 | +1.33 |
| 10,601
runs |
Ave = 9.4% |
| 2006
Season |
Total Runs | Total Wins | Win % | Total SP of winners | LSP/LSL in SP Range | LSP/LSL per Runner |
| FTO | 2,696 | 180 | 6.7% | 1882.25 | -633.75 | -0.24 |
| STO | 2,166 | 267 | 12.3% | 1370.50 | -528.50 | -0.24 |
| 3TO | 1,617 | 175 | 10.8% | 779.19 | -662.81 | -0.41 |
| 4TO | 1,032 | 130 | 12.6% | 648.48 | -253.52 | -0.25 |
| 5TO | 689 | 73 | 10.6% | 395.93 | -220.07 | -0.32 |
| 6TO | 473 | 52 | 11.0% | 264.72 | -156.28 | -0.33 |
| 7TO | 323 | 44 | 13.6% | 237.11 | -41.89 | -0.13 |
| 8TO | 195 | 19 | 9.7% | 145.63 | -30.37 | -0.16 |
| 9TO | 116 | 4 | 3.4% | 51.00 | -61.00 | -0.53 |
| 10TO | 65 | 6 | 9.2% | 40.80 | -18.2 | -0.28 |
| 11TO | 39 | 6 | 15.4% | 33.00 | 0 | 0 |
| 12TO | 25 | 3 | 12.0% | 48.00 | +26 | +1.04 |
| 13TO | 15 | 1 | 6.7% | 3.50 | - | -0.70 |
| 14TO | 8 | 0 | 0% | 0 | -8 | -1.00 |
| 9,466
runs |
Ave = 10.1% |
| 2007
Season |
Total Runs | Total Wins | Win % | Total SP of winners | LSP/LSL in SP Range | LSP/LSL per Runner |
| FTO | 3,014 | 206 | 6.8% | 2247.14 | -560.86 | -0.19 |
| STO | 2,464 | 274 | 11.1% | 1315.13 | -875.0 | -0.36 |
| 3TO | 1,916 | 189 | 9.9% | 958.00 | -769.0 | -0.40 |
| 4TO | 1,235 | 134 | 10.9% | 741.62 | -359.38 | -0.29 |
| 5TO | 880 | 99 | 11.3% | 516.49 | -264.51 | -0.30 |
| 6TO | 573 | 50 | 8.7% | 300.45 | -222.55 | -0.39 |
| 7TO | 353 | 42 | 11.9% | 323.05 | +12.05 | +0.03 |
| 8TO | 215 | 16 | 7.4% | 95.7 | -103.3 | -0.48 |
| 9TO | 125 | 13 | 10.4% | 101.84 | -10.16 | -0.08 |
| 10TO | 64 | 4 | 6.3% | 13.5 | -46.5 | -0.73 |
| 11TO | 33 | 3 | 9.1% | 6.75 | 23.25 | -0.70 |
| 12TO | 23 | 2 | 8.70% | 19 | -2 | -0.09 |
| 13TO | 13 | 1 | 7.7% | 3.5 | -8.5 | -0.65 |
| 14TO | 5 | 0 | 0% | 0 | -5 | -1.00 |
| 10,913
runs |
Ave = 9.5% |
The following chart presents the 'Level Stake Loss/Profit Per Runner' column from the previous tables for 2003 to 2005. The dotted black line represents the break even point whereby backing every runner in that run number group results in neither a loss nor a profit. The majority of points on the graph are below the break even line showing a loss on backing every runner in that group. The maximum that can be lost per runner is -1.0 (i.e. the level stake on all runners if none of them win). The amount the points are below the dotted line is a good indication of the amount of 'over round' that the Bookmaker has built into the SPs. This is the Bookmakers profit margin assuming they can get an ideal range of bets placed on all runners in a race.
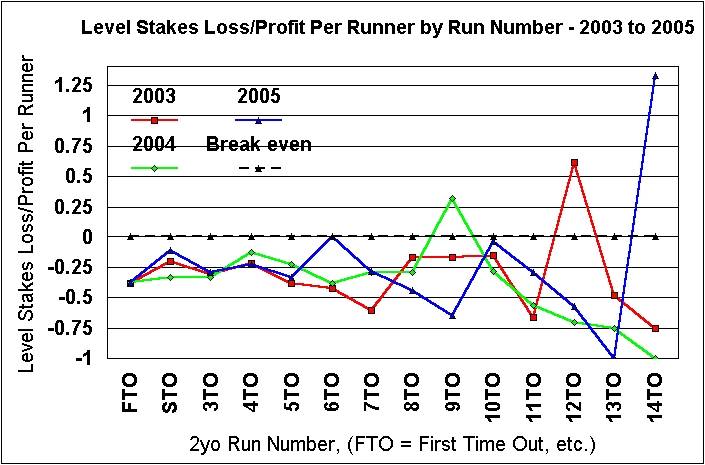
The chart shows some interesting points. The first point to note is that the few figures in Profit in each season are anomalies caused by the odd long priced winner amongst a small number of runners. They are not long term trends that can be relied on. What does appear to show up is that the 2yos on their Second (STO) and Fourth (4TO) runs show a lesser loss per runner than other outings. It is still a loss but suggests that 2yos on these outings are more competitive than the overall SP level suggests.
This makes sense for runners on their Second outing because they are often at their 'peak' to compete in maidens. The majority of trainers look for a 'nice' debut run which gives the 2yo confidence, knowledge and puts an edge on their fitness. They then aim to have their 2yos close to their best STO. Something to consider when your selection process has turned up a value alternative on their second outing.
The reason for the 4TO lesser loss is not so easy to pinpoint. One likely contributor is 4TO runners in Nurseries which again links to how trainers prepare their 2yos to hit 'peak' form. Unless they have already won a race then 2yos will be on their first handicap run 4TO and probably compete a little better than the average. The 4TO Level Stake Loss in 2005 season Nurseries, for example, was -0.18 compared to -0.23 in all race types.
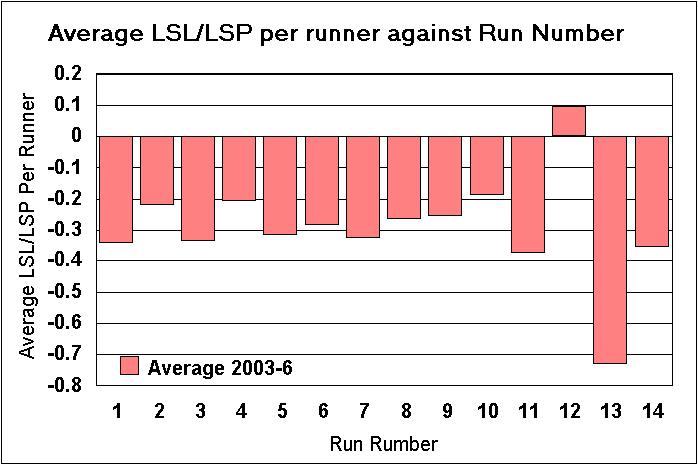
The following graph shows the similar information in a different form. The numbers along the x-axis are the Run Numbers for 2yos in the period 2003-6. For example, 1 means the 2yos first run (debut). The downward leading blocks show the Level Stakes Loss (LSL) you would have incurred in having a 1 point bet on every 2yo in that period on than run number. An LSL of -1.0 is the maximum with no winners and all of your stake money lost. The variation with runners on their twelfth outing showing a small profit is due to the small number of samples and a couple of long priced winners in the period. Note that the average loss across all runners is close to -0.3 (i.e., 30% of whatever you stakes totalled).
The interesting point is that over the period and with more than 10,000 samples the runners on their Second and Fourth outing lose about 33% less than those on their First or Third. Not a fact to make you rich but an indication of a slight edge that you can think about in your overall approach.
The above graph and text was produced in early 2007 and the turf season that year produced notably different results for the First and Second Runs. The table below summarises the LSL/LSP per runner by Run Number for the last six years. Odd cells show a profit (or no loss) during a season and are in bold text. The final figure under each season is the average loss per runner if you had a level stake on every 2yo runners that year. The drop to -0.26 & -0.28 in 2005-6 would represent a shift towards the general SP level being a touch more generous for punters and the layers' built-in profit margin lessened.
The cells in light blue are those where the loss in notably below the
general -0.30 loss per runner. The cells in pink are where the loss per
runner in notably worse than the general -0.30 average. Note how these
are grouped into the second half of the table denoting the later runs and
the SPs for horses on these outings are clearly much shorter than their
actual chance of success.
| LSL/LSP
per Runner |
2003
Season |
2004
Season |
2005
Season |
2006
Season |
2007
Season |
| FTO | -0.38 | -0.37 | -0.37 | -0.24 | -0.19 |
| STO | -0.20 | -0.33 | -0.11 | -0.24 | -0.36 |
| 3TO | -0.31 | -0.33 | -0.29 | -0.41 | -0.40 |
| 4TO | -0.22 | -0.13 | -0.23 | -0.25 | -0.29 |
| 5TO | -0.38 | -0.23 | -0.33 | -0.32 | -0.30 |
| 6TO | -0.42 | -0.38 | 0 | -0.33 | -0.39 |
| 7TO | -0.60 | -0.29 | -0.28 | -0.13 | +0.03 |
| 8TO | -0.17 | -0.29 | -0.44 | -0.16 | -0.48 |
| 9TO | -0.17 | +0.32 | -0.64 | -0.53 | -0.08 |
| 10TO | -0.15 | -0.28 | -0.04 | -0.28 | -0.73 |
| 11TO | -0.66 | -0.56 | -0.29 | 0 | -0.70 |
| 12TO | +0.62 | -0.70 | -0.57 | +1.04 | -0.09 |
| 13TO | -0.48 | -0.75 | -1.0 | -0.70 | -0.65 |
| 14TO | -0.75 | -1.00 | +1.33 | -1.00 | -1.00 |
| Ave of
all Runs |
-0.31 | -0.30 | -0.26 | -0.28 | -0.30 |
It is worth recording that in early 2008 the system for returning 'Starting Prices' is much more fragmented and to a large extent difficult to define. When the on-course betting market was relatively strong and the major 'high street' bookmakers used on-course representatives to adjust the price at the track the returned SP system was easy to describe. With the weakness of the market at many meetings, the proliferation of online gambling outlets the SP is more difficult to identify. The problem is made more difficult currently with no agreement over which body returns the SP and a number organisations reporting them.
The SPs used by B2yoR continue to be those reported by the "Racing Post" in their results section.