| << Stats Home | Horses | Races |
|
Starting Prices | Sire/Dam - General | Trainers - General |
| Season | Total Races | FTO Race Wins | % FTO Race Wins | % FTO Wins to Runs |
| 2002 | 942 | 147 | 15.6% | 5.7% |
| 2003 | 996 | 169 | 17.0% | 6.3% |
| 2004 | 998 | 184 | 18.4% | 6.2% |
| 2005 | 998 | 173 | 17.3% | 5.9% |
| 2006 | 960 | 180 | 18.8% | 6.7% |
| 2007 | 1,030 | 206 | 20.0% | 6.8% |
| 2008 | 1,048 | 195 | 18.6% | 6.2% |
| 2009 | 1,084 | 194 | 17.9% | 6.4% |
The main points to take from the table are :-
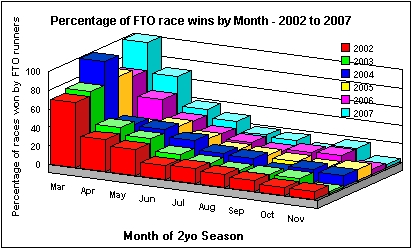
On average during the whole season 15-20% of races are won by runners
making their debut. The following table and graph shows how the percentage
of races won by first time out runners varies with month during
the 2yo season.
| Season | Mar | Apr | May | Jun | Jul | Aug | Sep | Oct | Nov |
| 2002 | 5 (71%) | 13 (35%) | 23 (28%) | 19 (15%) | 29 (16%) | 25 (14%) | 19 (12%) | 13 (9%) | 1 (9%) |
| 2003 | 9 (75%) | 17 (35%) | 29 (28%) | 25 (15%) | 26 (16%) | 22 (14%) | 21 (12%) | 19 (12%) | 1 (3%) |
| 2004 | 10 (100%) | 17 (38%) | 34 (37%) | 36 (28%) | 35 (19%) | 14 (8%) | 16 (8%) | 20 (14%) | 2 (12%) |
| 2005 | 7 (78%) | 14 (29%) | 29 (33%) | 30 (24%) | 27 (15%) | 26 (14%) | 23 (12%) | 15 (10%) | 2 (12%) |
| 2006 | 5 (71%) | 20 (51%) | 25 (31%) | 27 (22%) | 29 (17%) | 22 (11%) | 28 (15%) | 23 (16%) | 1 (6%) |
| 2007 | 2 (100%) | 24 (69%) | 33 (38%) | 34 (29%) | 27 (19%) | 32 (16%) | 18 (9%) | 33 (16%) | 2 (4%) |
| 2008 | 3 (60%) | 25 (63%) | 39 (40%) | 25 (21%) | 33 (19%) | 21 (11%) | 19 (10%) | 25 (13%) | 5 (16%) |
| 2009 | 4 (100%) | 15 (41%) | 29 (27%) | 29 (23%) | 31 (17%) | 29 (14%) | 28 (13%) | 26 (13%) | 3 (14%) |
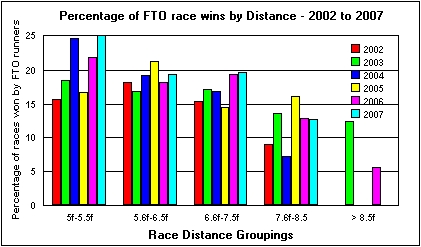
On average during the whole season 15-18% of races are won by
runners making their debut. The following table and graph shows how the
percentage of races won by first time out runners varies with race distance
for the 2yo season.
| Season | 5f - 5.5f | 5.6f - 6.5f | 6.6f - 7.5f | 7.6f - 8.5f | > 8.6f |
| 2002 | 15.7% | 18.2% | 15.4% | 8.9% | 0% |
| 2003 | 18.5% | 16.9% | 17.1% | 13.6% | 12.5% |
| 2004 | 24.6% | 19.2% | 16.9% | 7.3% | 0% |
| 2005 | 16.7% | 21.2% | 14.5% | 16.1% | 0% |
| 2006 | 21.9% | 18.2% | 19.3% | 12.9% | 5.6% |
| 2007 | 25.9% | 19.3% | 19.6% | 12.8% | 0% |
| 2008 | 26.7% | 15.2% | 15.8% | 17.9% | 5.9% |
| 2009 | 19.0% | 17.7% | 18.4% | 17.5% | 4.0% |
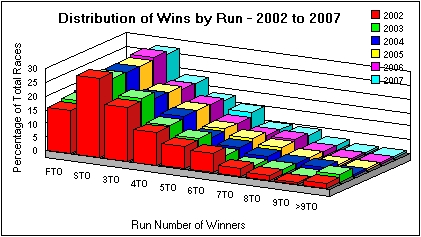
The table below shows the number of races in the season that
were won by 2yos on a particular outing. In 2007 there were 1,030 races
and 206 were won by runners on their debut (FTO) for example.
| Season | FTO | STO | 3TO | 4TO | 5TO | 6TO | 7TO | 8TO | 9TO | 10TO | 11TO | 12TO+ |
| 2002 | 147 (16%) | 273 (29%) | 192 (20%) | 115 (12%) | 76 (8%) | 64 (7%) | 28 (3%) | 21 (2%) | 8 (1%) | 7 | 5 | 6 |
| 2003 | 169 (17%) | 269 (27%) | 213 (21%) | 125 (13%) | 90 (9%) | 44 (4%) | 22 (2%) | 23 (2%) | 13 (1%) | 14 | 4 | 10 |
| 2004 | 184 (18%) | 272 (27%) | 190 (19%) | 140 (14%) | 74 (7%) | 52 (5%) | 34 (3%) | 20 (2%) | 19 (2%) | 7 | 3 | 3 |
| 2005 | 173 (17%) | 270 (27%) | 193 (19%) | 137 (14%) | 83 (8%) | 64 (6%) | 37 (4%) | 20 (2%) | 7 (1%) | 9 | 4 | 3 |
| 2006 | 180 (19%) | 267 (28%) | 175 (18%) | 130 (14%) | 73 (8%) | 52 (5%) | 44 (5%) | 19 (2%) | 4 | 6 | 6 | 5 |
| 2007 | 206 (20%) | 274 (27%) | 188 (18%) | 133 (13%) | 99 (10%) | 49 (5%) | 42 (4%) | 16 (2%) | 12 | 4 | 3 | 3 |
| 2008 | 195 (18%) | 303 (29%) | 205 (19%) | 125 (12%) | 97 (9%) | 56 (5%) | 33 (3%) | 12 (1%) | 11 | 7 | 4 | 3 |
| 2009 | 194 (18%) | 315 (28%) | 213 (20%) | 140 (13%) | 95 (9%) | 49 (5%) | 35 (3%) | 21 (2%) | 9 | 6 | 4 | 7 |
Note two main points from the table and the graph:-
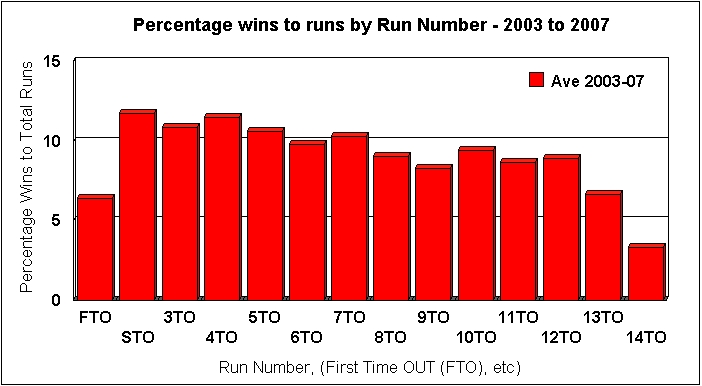
The previous section dealt with the number of races that were won by
runners on a particular outing in their 2yo career. This section covers
the number of wins by run number across all outings by 2yos in the
season.
| 2003 Season | 2004 Season | 2005 Season | |||||||||
| Total Runs | Total Wins | Win % | Total Runs | Total Wins | Win % | Total Runs | Total Wins | Win % | |||
| FTO | 2,647 | 169 | 6.4% | FTO | 2,912 | 184 | 6.3% | FTO | 2,904 | 173 | 6.0% |
| STO | 2,167 | 269 | 12.4% | STO | 2,362 | 272 | 11.5% | STO | 2,356 | 270 | 11.5% |
| 3TO | 1,640 | 213 | 13% | 3TO | 1,821 | 190 | 10.4% | 3TO | 1,834 | 193 | 10.5% |
| 4TO | 1,083 | 126 | 11.6% | 4TO | 1,258 | 140 | 11.1% | 4TO | 1,199 | 137 | 11.4% |
| 5TO | 766 | 90 | 11.7% | 5TO | 809 | 74 | 9.1% | 5TO | 801 | 83 | 10.4% |
| 6TO | 504 | 44 | 8.7% | 6TO | 548 | 52 | 9.5% | 6TO | 562 | 64 | 11.4% |
| 7TO | 352 | 22 | 6.3% | 7TO | 347 | 34 | 9.8% | 7TO | 359 | 37 | 10.3% |
| 8TO | 233 | 23 | 9.9% | 8TO | 217 | 20 | 9.2% | 8TO | 218 | 20 | 9.2% |
| 9TO | 153 | 13 | 8.5% | 9TO | 128 | 19 | 14.8% | 9TO | 148 | 7 | 4.7% |
| 10TO | 104 | 14 | 13.5% | 10TO | 80 | 7 | 8.8% | 10TO | 95 | 9 | 9.5% |
| 11TO | 73 | 4 | 5.5% | 11TO | 42 | 3 | 7.1% | 11TO | 62 | 4 | 6.4% |
| 12TO | 47 | 6 | 12.8% | 12TO | 22 | 1 | 4.5% | 12TO | 30 | 2 | 6.7% |
| 13TO | 25 | 3 | 12% | 13TO | 14 | 1 | 7.1% | 13TO | 15 | 0 | 0% |
| 14TO | 18 | 1 | 5.6% | 14TO | 3 | 0 | 0% | 14TO | 9 | 1 | 11.1% |
| 9,812 runs |
|
10,567 runs | Ave = 9.4% | 10,601
runs |
Ave = 9.4% |
| 2006 Season | 2007 Season | ||||||
| Total Runs | Total Wins | Win % | Total Runs | Total Wins | Win % | ||
| FTO | 2,696 | 180 | 6.7% | FTO | 3,014 | 206 | 6.8% |
| STO | 2,166 | 267 | 12.3% | STO | 2,464 | 274 | 11.1% |
| 3TO | 1,617 | 175 | 10.8% | 3TO | 1,916 | 189 | 9.9% |
| 4TO | 1,032 | 130 | 12.6% | 4TO | 1,235 | 134 | 10.9% |
| 5TO | 689 | 73 | 10.6% | 5TO | 880 | 99 | 11.3% |
| 6TO | 473 | 52 | 11.0% | 6TO | 573 | 50 | 8.7% |
| 7TO | 323 | 44 | 13.6% | 7TO | 353 | 42 | 11.9% |
| 8TO | 195 | 19 | 9.7% | 8TO | 215 | 16 | 7.4% |
| 9TO | 116 | 4 | 3.4% | 9TO | 125 | 13 | 10.4% |
| 10TO | 65 | 6 | 9.2% | 10TO | 64 | 4 | 6.3% |
| 11TO | 39 | 6 | 15.4% | 11TO | 33 | 3 | 9.1% |
| 12TO | 25 | 3 | 12.0% | 12TO | 23 | 2 | 8.7% |
| 13TO | 15 | 1 | 6.7% | 13TO | 13 | 1 | 7.7% |
| 14TO | 8 | 0 | 0% | 14TO | 5 | 0 | 0% |
| 9,466 |
|
10,913 | Ave =
9.5% |
| Season | Total | FTO | STO | 3TO | 4TO | 5TO | 6TO | 7TO | 8TO | 9TO | 10+ |
| 2002 | 424 | 107 (25%) | 178 (42%) | 88 (21%) | 29 (7%) | 8 | 11 | 2 | 1 | 0 | 0 |
| 2003 | 450 | 129 (29%) | 165 (37%) | 93 (21%) | 35 (8%) | 15 | 4 | 2 | 1 | 2 | 4 |
| 2004 | 453 | 137 (30%) | 163 (36%) | 92 (20%) | 32 (7%) | 13 | 8 | 4 | 4 | 0 | 0 |
| 2005 | 477 | 134 (28%) | 178 (37%) | 101 (21%) | 34 (7%) | 14 | 6 | 6 | 1 | 1 | 3 |
| 2006 | 458 | 140 (31%) | 164 (36%) | 96 (21%) | 28 (6%) | 16 | 7 | 3 | 1 | 1 | 2 |
| 2007 | 516 | 153 (30%) | 179 (35%) | 99 (19%) | 43 (8%) | 24 | 13 | 3 | 3 | 0 | 0 |
| 2008 | 521 | 148 (28%) | 202 (39%) | 116 (22%) | 37 (7%) | 9 | 4 | 2 | 2 | 1 | 0 |
| 2009 | 537 | 147 (27%) | 213 (40%) | 117 (22%) | 30 (6%) | 14 | 10 | 3 | 3 | 0 | 0 |
The table shows the breakdown of maiden races by the run number that the winners were on. Note that around two thirds of Maiden races are won by runners that are on their first or second starts.
Maiden races which are won by runners after a high number of previous starts are usually at lesser courses and require moderate winning performances. The three wins by runners on their tenth, or later, start in 2005 were at Catterick, Nottingham & Wolverhampton and rated only 63, 61 & 55. In 2006 the two wins were at Catterick & Bath rating 56 and 62. The three 8TO wins in 2007 were at Brighton, Wolverhampton & Yarmouth with two at higher end seller race quality ratings.
In 2008 four of the 5 maiden wins at 7TO or higher were at Brighton, Catterick, Redcar & Warwick by horses who had a BHA rating of 64 or 72. The one exception was Richard Hannon's Heliodor who was rated OR78 and won at Goodwood. He made an early May debut over 5f and ran in a number of races that suggested the trainer thought he was useful. The impression in mid-season was that he had OR80+ ability but was idle and would not show it on the racecourse. He eventually won when stepped up to 9f in late season and won a Conditions race over 10f afterwards.
In 2009 the six 7-8TO wins were made up of two at Bath plus one each at Catterick, Hamilton, Thirsk & Wolverhampton. 5 of the 6 were in the OR58-72 BHA rating range and classic 'Eternal Placer' quality runners in that sense. 4 of the 6 were notable as pace forcing 'short runners' who struggled to last out 5f in earlier races and found easy events to win when they had learnt to settle down a little in the initial stages of races.
The one exception was Rakaan who had placed in the Coventry Stakes but then struggled to win in maiden races afterwards. He was trained by Bryan Meehan who regularly has this type of horse and watching them try to manage tidying up maiden wins from August onwards a traditional part of the season. Rakaan is an interesting horse overall and matching his physical make-up to his Run Style and then adding in the Meehan factor is very instructive in why he took 8 attempts to win.
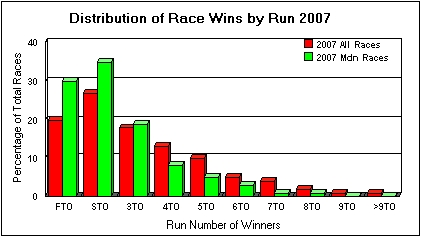
The table below compares the percentages of 2yo races won in 2007 on each Run Number for All Races (red bars) and for the 516 Maiden Races only (green). The relative bias towards maiden races being won by 2yos on one of their first three outings can be seen. For all starts after 3TO the 2yos in the Maiden Races achieved a lower percentage of race wins than was achieved across all 2yo races.
| Season | Total | STO | 3TO | 4TO | 5TO | 6TO | 7TO | 8TO | 9TO | 10TO+ |
| 2004 | 136 | 2 | 9 | 39 | 28 | 16 | 7 | 7 | 15 | 2 |
| 2005 | 134 | 1 | 12 | 42 | 31 | 23 | 11 | 7 | 3 | 6 |
| 2006 | 135 | 1 | 11 | 39 | 27 | 19 | 18 | 9 | 2 | 9 |
| 2007 | 161 | 2 | 9 | 52 | 40 | 21 | 20 | 8 | 6 | 4 |
| 2008 | 161 | 1 | 12 | 54 | 40 | 25 | 18 | 4 | 4 | 3 |
| 2009 | 183 | 0 | 16 | 51 | 53 | 25 | 17 | 4 | 8 | 9 |
In 2007 there were 14 debut winners who ran in Nurseries on their second outings with 2 winning (14.3%) at SPs of 11/2 and 3/1 (dead heat) and a solid loss to level stakes. The 9 winners on 3TO were from a group of 86 representatives with the longest SP of a winner 11/2 and with five of them at less than 5/2 and a strong loss to level staking on all qualifiers.
Trainer Mick Channon has been responsible for 6 of the 19 Nursery winners on their tenth or later runs in the three seasons 2005-7, typically with a runner that won in early season. These have either been runners that improved in later season (e.g. Wovoka & Grantley Adams) or moderate types that have run often enough for their handicap mark to get back down to a competitive level for the individual. The two winners in 2004 had both run in the first 2yo race of that season at Lingfield on the polytrack on March 20th.
In 2008 the 7 winners at 9TO or higher were split as two for PD (David) Evans (with Kingswinford on his 12th & 14th runs), two for Bryan Meehan and one each for Mick Channon, Jonathan Jay & Mark Johnston.
In 2009 Mr Channon had four different horses that won in Nurseries on 9TO or later. Three other trainers had two successes but all were double wins by the same horse with PD Evans with Transfixed (13th & 20th runs and the busiest 2yo with 24 runs by turf season end and carried on running through the Winter on the AW), PS Mcentee (Angie's Nap, whom he had claimed during the season) & N Tinkler (Bossy Kitty on her 12-13th outings).
8. What finishing position had STO/3TO first time winners achieved in their previous run?
The table covers all horses who had their first win on either
their second or third run, i.e. previous winners who won again on their
second and/or third run are not included.
| Season | S-3TO FT winners | Second | Third | Fourth | Fifth | Sixth | Seventh+ |
| 2002 | 365 | 97 (27%) | 75 (21%) | 70 (19%) | 33 (9%) | 30 (8%) | 60 (16%) |
| 2003 | 375 | 96 (26%) | 85 (23%) | 48 (13%) | 37 (10%) | 31 (8%) | 78 (21%) |
| 2004 | 375 | 101 (27%) | 63 (17%) | 60 (16%) | 43 (12%) | 36 (10%) | 72 (19%) |
| 2005 | 396 | 100 (25%) | 72 (18%) | 60 (15%) | 44 (11%) | 38 (10%) | 82 (21%) |
| 2006 | 363 | 99 (27%) | 59 (16%) | 60 (17%) | 37 (10%) | 23 (6%) | 85 (23%) |
| 2007 | 393 | 94 (24%) | 64 (16%) | 68 (17%) | 41 (11%) | 42 (11%) | 84 (21%) |
The following table splits the totals for finishing position on previous
run for first time winners on second outings (STO) and third time out.
| Second TO
Winners |
Total First
time winners |
Second | Third | Fourth | Fifth | Sixth | Seventh+ |
| 2002 | 234 | 59 (25%) | 45 (19%) | 42 (18%) | 24 (10%) | 23 (10%) | 41 (18%) |
| 2003 | 232 | 50 (22%) | 51 (22%) | 30 (13%) | 26 (11%) | 19 (8%) | 56 (24%) |
| 2004 | 234 | 64 (27%) | 39 (17%) | 32 (14%) | 31 (13%) | 23 (10%) | 45 (19%) |
| 2005 | 247 | 56 (23%) | 41 (17%) | 38 (15%) | 31 (13%) | 27 (11%) | 54 (22%) |
| 2006 | 236 | 56 (24%) | 35 (15%) | 38 (16%) | 22 (9%) | 18 (8%) | 67 (28%) |
| 2007 | 241 | 56 (23%) | 35 (15%) | 41 (17%) | 23 (9%) | 31 (13%) | 55 (23%) |
| Third TO
Winners |
Total First
Time winners |
Second | Third | Fourth | Fifth | Sixth | Seventh+ |
| 2002 | 131 | 38 (29%) | 30 (23%) | 28 (21%) | 9 (7%) | 7 (5%) | 19 (15%) |
| 2003 | 143 | 46 (32%) | 34 (24%) | 18 (13%) | 11 (8%) | 12 (8%) | 22 (15%) |
| 2004 | 141 | 37 (26%) | 24 (17%) | 28 (20%) | 12 (9%) | 13 (9%) | 27 (19%) |
| 2005 | 149 | 44 (30%) | 31 (21%) | 22 (15%) | 13 (9%) | 11 (7%) | 28 (19%) |
| 2006 | 127 | 43 (34%) | 24 (19%) | 22 (17%) | 15 (12%) | 5 (4%) | 18 (14%) |
| 2007 | 152 | 38 (25%) | 29 (19%) | 27 (18%) | 18 (12%) | 11 (7%) | 29 (19%) |
Note from the table that, as would be expected, first time 3TO winners are more likely to have made the first four on their last outing that first time STO winners. Typically just over 50% of first time 3TO winners will have placed second or third on their previous outing.
[Feb 2008 update:- This section has not been updated for 2007
data. The B2yoR estimates assigned during 2007 have been reviewed and amended
as part of ongoing improvements to the ratings methods. The "70+" level
in 2007 is not immediately comparable to the 2005-6 seasons at present.
An Article covering the changes to the B2yoR estimates will be published
by the start of the 2008 turf season. ]
The tables below cover the 2005-6 seasons and use the B2yoR ratings
which are assigned during the season.
| Season | Total Races | Number of Winners
rated 80+ |
Number of Winners
rated 70+ |
Number of Winners
rated 60+ |
Number of Winners
rated 50+ |
| 2005 | 998 | 129 (12.9%) | 457 (45.8%) | 806 (80.1%) | 936 (93.8%) |
| 2006 | 960 | 67 (7.0%) | 260 (27.1%) | 604 (62.9%) | 874 (91.0%) |
| 2005 Season
Race Type |
Total Races | Number of Winners
rated 80+ |
Number of Winners
rated 70+ |
Number of Winners
rated 60+ |
| Group/Listed | 62 | 57 (92%) | 62 (100%) | - |
| Conditions | 44 | 16 (36.4%) | 39 (88.6%) | 44 (100%) |
| Novice | 64 | 12 (18.8%) | 45 (70.3%) | 62 (97%) |
| Maidens | 478 | 32 (6.7%) | 219 (45.8%) | 436 (91.2%) |
| Auctions | 137 | 1 (0.7%) | 25 (18.2%) | 86 (62.8%) |
| Claimer/Seller | 80 | 0 | 1 (1.3%) | 7 (8.8%) |
[Feb 2008 update:- This section has not been updated for 2007
data. The B2yoR estimates assigned during 2007 have been reviewed and amended
as part of ongoing improvements to the ratings methods. The ratings level
in 2007 is not immediately comparable to the 2005-6 seasons at present.
An Article covering the changes to the B2yoR estimates will be published
by the start of the 2008 turf season. ]
The tables below cover the 2005-6 seasons and use the B2yoR ratings
which are assigned during the season.
| Season | Maiden Races | Average Rating
for Winner |
| 2005 | 478 | 68.5 |
| 2006 | 458 | 63.1 |
| 2005 Season | Number of | Average Rating | Course
Ranked |
Average
Rating |
||
| Course | Maiden Races | for Winner | by Average
Rating |
for Winner
2005 |
2006
Average |
|
| AYR | 11 | 67.5 | NEWMARKET JULY | 73.5 | 65.3 | |
| BATH | 18 | 67.7 | YORK | 73.4 | 71.8 | |
| BRIGHTON | 11 | 65.5 | DONCASTER | 73.3 | N/A | |
| BEVERLEY | 9 | 67.4 | GOODWOOD | 71.9 | 68.1 | |
| CARLISLE | 8 | 66.4 | NEWBURY | 71.6 | 67.9 | |
| CATTERICK | 9 | 64.0 | WINDSOR | 71.2 | 63.1 | |
| CHEPSTOW | 7 | 67.6 | CHESTER | 70.8 | 69.6 | |
| CHESTER | 5 | 70.8 | EPSOM | 70.8 | 66.3 | |
| DONCASTER | 11 | 73.3 | RIPON | 70.8 | 62.9 | |
| EDINBURGH | 10 | 61.8 | LINGFIELD | 70.4 | 64.0 | |
| EPSOM | 9 | 70.8 | NEWMARKET ROWLEY | 70.4 | 66.6 | |
| FOLKESTONE | 13 | 68.2 | HAYDOCK | 70.3 | 61.3 | |
| GOODWOOD | 14 | 71.9 | SALISBURY | 70.2 | 66.3 | |
| HAMILTON | 11 | 69.4 | PONTEFRACT | 70.1 | 59.5 | |
| HAYDOCK | 16 | 70.3 | KEMPTON | 69.7 | 62.6 | |
| KEMPTON | 3 | 69.7 | SANDOWN | 69.6 | 64.4 | |
| LEICESTER | 21 | 67.5 | HAMILTON | 69.4 | 61.7 | |
| LINGFIELD | 8 | 70.4 | FOLKESTONE | 68.2 | 61.6 | |
| LINGFIELD (AW) | 26 | 67.0 | BATH | 67.7 | 61.7 | |
| NEWCASTLE | 13 | 67.5 | THIRSK | 67.7 | 60.5 | |
| NEWMARKET JULY | 24 | 73.5 | CHEPSTOW | 67.6 | 63.0 | |
| NEWMARKET ROWLEY | 21 | 70.4 | AYR | 67.5 | 59.2 | |
| NOTTINGHAM | 27 | 65.4 | LEICESTER | 67.5 | 65.1 | |
| NEWBURY | 25 | 71.6 | NEWCASTLE | 67.5 | 60.6 | |
| PONTEFRACT | 11 | 70.1 | BEVERLEY | 67.4 | 67.6 | |
| REDCAR | 14 | 66.7 | LINGFIELD (AW) | 67.0 | 62.2 | |
| RIPON | 8 | 70.8 | REDCAR | 66.7 | 63.1 | |
| SALISBURY | 13 | 70.2 | CARLISLE | 66.4 | 59.8 | |
| SANDOWN | 12 | 69.6 | YARMOUTH | 66.4 | 60.9 | |
| SOUTHWELL (AW) | 7 | 59.4 | BRIGHTON | 65.5 | 59.5 | |
| THIRSK | 12 | 67.7 | NOTTINGHAM | 65.4 | 62.5 | |
| WARWICK | 10 | 63.8 | WOLVERHAMPTON | 64.7 | 61.3 | |
| WINDSOR | 22 | 71.2 | CATTERICK | 64.0 | 60.9 | |
| WOLVERHAMPTON | 14 | 64.7 | WARWICK | 63.8 | 59.2 | |
| YARMOUTH | 16 | 66.4 | EDINBURGH | 61.8 | 55.0 | |
| YORK | 9 | 73.4 | SOUTHWELL | 59.4 | 57.3 | |
| ASCOT | N/A | 69.7 |