| << Stats Home | Horses | Races | Winners | Starting Prices | Sire/Dam - General |
|
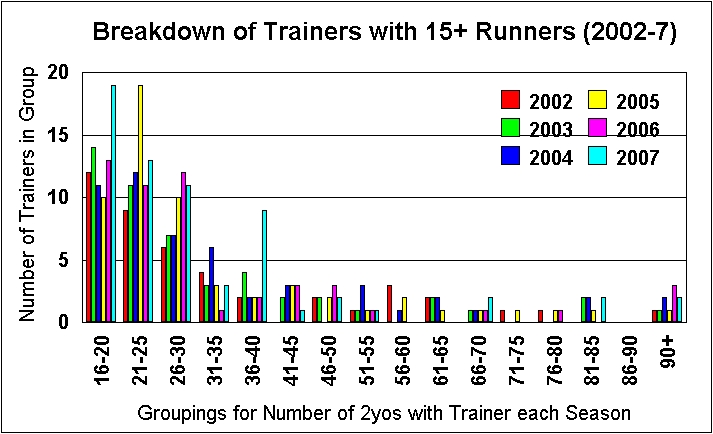
| Season | Total Trainers | Trainers with 1 to 10 runners | Trainers with 11 to 20 runners | Trainers with more than 20 runners |
| 2002 | 305 | 236 (77%) | 37 (12%) | 32 (11%) |
| 2003 | 316 | 242 (77%) | 38 (12%) | 36 (11%) |
| 2004 | 317 | 240 (76%) | 36 (11%) | 41 (13%) |
| 2005 | 316 | 238 (75%) | 30 (10%) | 48 (15%) |
| 2006 | 313 | 234 (75%) | 41 (13%) | 38 (12%) |
| 2007 | 327 | 242 (74%) | 39 (12%) | 46 (14%) |
| 2008 | 315 | 228 (72%) | 44 (14%) | 43 (14%) |
| 2009 | 322 | 235 (73%) | 44 (14%) | 43 (13%) |
The trainer R. Hannon has had more than 90 runners in each of the four seasons with the yearly totals 99-112-97-100. The other trainer to have run more than 90 individual runners was SB Suroor in 2004 when he took over responsibility for the Godolphin 2yos from DR Loder.
In 2006 trainer M. Johnston took top spot by number of runners with 102, followed by R. Hannon on 97 & M.R. Channon with 91. In 2007, assisted by a large batch of Maktoum owner breds, M. Johnston increased his total to 118 with R. Hannon still in second with 108.
| Season | Total Trainers with 2yo wins | Trainers with 1 to 5 wins | Trainers with 6-10 wins | Trainers with 11-20 wins | Trainers with more than 20 wins |
| 2002 | 138 | 93 (67%) | 19 (14%) | 15 (11%) | 11 (8%) |
| 2003 | 150 | 103 (68%) | 18 (12%) | 19 (13%) | 10 (7%) |
| 2004 | 158 | 109 (69%) | 19 (12%) | 21 (13%) | 9 (6%) |
| 2005 | 153 | 104 (68%) | 27 (18%) | 11 (7%) | 11 (7%) |
| 2006 | 144 | 98 (68%) | 22 (15%) | 15 (10%) | 9 (6%) |
| 2007 | 156 | 104 (67%) | 23 (15%) | 19 (12%) | 10 (6%) |
| 2008 | 155 | 104 (67%) | 25 (16%) | 15 (10%) | 11 (7%) |
| 2009 | 161 | 115 (71%) | 23 (14%) | 12 (8%) | 11 (7%) |
The group of trainers that have had more than 20 wins in the period 2002-5 is made up of :-
2007 saw 10 trainers with more than 20 wins including all five of the core from the period with Hannon, Channon, Johnston, Stoute & Gosden in the list and R. Hannon top with 60 successes. The other five included two regulars with BW Hills and BJ Meehan and KA Ryan confirmed his place in the top 10 although getting less wins than in 2006. The remaining two members of the Top 10 JA Osborne back in the list and B. Smart having a notably good year and his best total of successes. Mr Osborne again needed a targeted 'plan' to upgrade his performance and gave his bloodstock agent at the 2006 yearling sales specific instructions to buy precocious 2yos so that he could have "...ten 2yo winners by Royal Ascot." He achieved that and a run of late season wins in claimers and nurseries took him past 20 for the first time since 2003 and halt the year-by-year decline since that headline year.
The full list of Runners & Winners for all trainers is held for each recent season on the B2yoR site. The 2009 Trainer Summary Index Page is linked here to provide an example.
The following table shows the number of 2yos that wore some form of
headgear - blinkers, visors, eyeshields, cheekpieces and tongue ties
- during the 2004-9 seasons.
| Season | Total 2yo runs | Total Runs in 'Headgear' | % Runs in 'Headgear' |
| 2004 | 10,567 | 722 | 6.8% |
| 2005 | 10,601 | 669 | 6.3% |
| 2006 | 9,466 | 484 | 5.1% |
| 2007 | 10,913 | 639 | 5.9% |
| 2008 | 10,537 | 588 | 5.6% |
| 2009 | 10,592 | 642 | 6.1% |
The 'Headgear category' can be split into two sub-groups
with the largest being those horses which wore vision restrictors (VR)
of some kind. These are blinkers, visors, eyeshields, cheekpieces and hoods
and their use has to be declared by the trainer before the race. If there
is any problem with their use on the day the horse will not be allowed
to run. For instance, if the trainer forgets to fit the blinkers and the
runner arrives at the start without them. Note that sheepskin nosebands
(known as 'shadow rolls' in some countries and presumed to stop horses
shying, 'Dayjur' style, at shadows in front of them) which have long been
in use and well before the recent introduction of cheekpieces, do not need
to be declared and are considered part of the normal equipment.
| Season | Total 2yo Runs | Total Runs in VR | % Runs in VR | % Wins to Runs in VR | % of Trainers using VR |
| 2004 | 10,567 | 525 | 5.0% | 7.6% [9.4%] | 35.9% |
| 2005 | 10,601 | 533 | 5.0% | 6.6% [9.4%] | 42.0% |
| 2006 | 9,466 | 409 | 4.3% | 8.6% [10.1%] | 32.9% |
| 2007 | 10,913 | 506 | 4.6% | 6.9% [9.5%] | 35.3% |
| 2008 | 10,537 | ||||
| 2009 | 10,592 | 521 | 4.9% | 6.7% [10.2%] | 41.6% |
The following tables show which trainers,
that had more than 50 runs
in the 2004-9 seasons, used Vision Restrictors most often.
| 2004 | Season | 2005 | Season | |||||||||
| Trainer | Total Number of Runs | % Wins-Runs without VR | Number of Runs in VR | % Runs in VR | % Wins-Runs in VR | Trainer | Total Number of Runs | % Wins-Runs without VR | Number of Runs in VR | % Runs in VR | % Wins-Runs in VR | |
| W Turner | 106 | 10.9% | 31 | 29.2% | 22.6% | M Dods | 61 | 6.0% | 11 | 18.0% | 0% | |
| M Dods | 53 | 7.7% | 14 | 26.4% | 0% | KA Ryan | 174 | 15.9% | 29 | 16.7% | 6.9% | |
| A Duffield | 53 | 7.1% | 11 | 20.8% | 0% | K Burke | 123 | 14.4% | 19 | 15.4% | 10.5% | |
| JS Moore | 78 | 7.7% | 13 | 16.7% | 0% | JS Moore | 111 | 9.8% | 17 | 15.3% | 5.9% | |
| B Meehan | 207 | 14.0% | 25 | 12.1% | 17.9% | JR Weymes | 80 | 4.4% | 12 | 15.0% | 0% | |
| P Haslam | 133 | 4.3% | 16 | 12.0% | 0% | P Haslam | 84 | 1.4% | 12 | 14.3% | 0% | |
| P D'Arcy | 53 | 4.3% | 6 | 11.3% | 16.7% | J Gosden | 144 | 19.2% | 19 | 13.2% | 5.2% | |
| DR Loder | 146 | 12.3% | 16 | 11.0% | 18.8% | B Meehan | 201 | 11.3% | 24 | 11.9% | 8.3% | |
| PD Evans | 92 | 6.1% | 106 | 10.9% | 20.0% | BR Millman | 100 | 12.4% | 11 | 11.0% | 0% | |
| IA Wood | 149 | 9.8% | 16 | 10.7% | 6.3% | W Turner | 110 | 7.1% | 12 | 10.9% | 25% | |
| WR Muir | 98 | 3.4% | 10 | 10.2% | 0% | WR Muir | 68 | 11.5% | 7 | 10.3% | 14.3% | |
| A Berry | 179 | 6.8% | 18 | 10.1% | 11.1% | M Quinlan | 73 | 9.1% | 7 | 9.6% | 14.3% | |
| T Easterby | 238 | 8.4% | 23 | 9.7% | 4.3% | T Easterby | 276 | 6.8% | 26 | 9.4% | 3.8% | |
| K Burke | 105 | 16.1% | 10 | 9.5% | 10% | PD Evans | 134 | 7.4% | 12 | 9.0% | 8.3% |
| 2006 | Season | 2007 | Season | |||||||||
| Trainer | Total Number of Runs | % Wins-Runs without VR | Number of Runs in VR | % Runs in VR | % Wins-Runs in VR | Trainer | Total Number of Runs | % Wins-Runs without VR | Number of Runs in VR | % Runs in VR | % Wins-Runs in VR | |
| A Duffield | 80 | 8.3% | 20 | 25.0% | 20.0% | BJ Meehan | 274 | 12.8% | 26 | 9.5% | 7.7% | |
| MW Easterby | 115 | 4.1% | 17 | 14.8% | 5.9% | TD Easterby | 169 | 4.1% | 21 | 12.4% | 9.5% | |
| BJ Meehan | 262 | 15.9% | 17 | 6.5% | 5.9% | JS Moore | 171 | 7.0% | 20 | 11.7% | 4.0% | |
| KA Ryan | 227 | 15.6% | 16 | 7.0% | 0% | PD Evans | 131 | 3.8% | 16 | 12.2% | 6.3% | |
| WR Muir | 74 | 6.9% | 16 | 21.6% | 6.3% | KA Ryan | 281 | 11.0% | 15 | 5.3% | 20.0% | |
| WGM Turner | 106 | 5.5% | 15 | 14.2% | 33.3% | MR Channon | 451 | 11.5% | 12 | 2.7% | 0% | |
| PD Evans | 97 | 9.8% | 15 | 15.5% | 0% | JA Osborne | 163 | 14.7% | 10 | 6.1% | 20.0% | |
| KR Burke | 155 | 15.5% | 13 | 8.4% | 7.7% | |||||||
| JS Moore | 101 | 13.3% | 11 | 10.9% | 27.3% | |||||||
| MDI Usher | 53 | 2.3% | 10 | 18.9% | 0% |
| 2008 | Season | 2009 | Season | |||||||||
| Trainer | Total Number of Runs | % Wins-Runs without VR | Number of Runs in VR | % Runs in VR | % Wins-Runs in VR | Trainer | Total Number of Runs | % Wins-Runs without VR | Number of Runs in VR | % Runs in VR | % Wins-Runs in VR | |
| % | % | % | KA Ryan | 187 | 8.0% | 36 | 19.3% | 5.6% | ||||
| % | % | % | TD Easterby | 163 | 5.5% | 18 | 11.0% | 11.1% | ||||
| % | % | % | PT Midgley | 110 | 6.4% | 17 | 15.5% | 5.9% | ||||
| % | % | % | JS Moore | 105 | 2.9% | 15 | 14.3% | 0% | ||||
| % | % | % | WR Muir | 90 | 10.0% | 15 | 16.7% | 13.3% | ||||
| % | % | % | JHM Gosden | 122 | 15.6% | 13 | 10.7% | 0% | ||||
| % | % | % | PC Haslam | 65 | 7.7% | 13 | 20.0% | 7.7% | ||||
| % | % | % | DK Ivory | 52 | 3.8% | 11 | 21.2% | 0% | ||||
| % | % | % | BJ Meehan | 205 | 13.7% | 11 | 5.4% | 18.2% | ||||
| % | % | % | SB Suroor | 236 | 30.1% | 11 | 4.7% | 45.4% |
Runners wear tongue ties (TT) to keep the tongue in place and to stop it moving back into the throat and interfering with the horse's breathing ("swallowing the tongue"). The tongue tie can be made out of a variety of materials with strips of ladies' tights and specially made leather straps amongst the most common types.
The use of the tongue tie must be declared by the trainer before a race
and a runner will not be allowed to compete if the tongue tie is not in
place. For instance, there have been non runners during 2005 when the tongue
tie has been dislodged and lost on the way to post. There have also been
delayed starts while jockeys (with gloves) and officials try to unpick
knots in ties made of tights before trying to refit them (all very scientific).
| Season | Total 2yo Runs | Total Runs in TT | % Runs in TT | % Wins to Runs in TT | % of Trainers using TT |
| 2004 | 10,567 | 178 | 1.7% | 9.6% [9.4%] | 14.5% |
| 2005 | 10,601 | 145 | 1.4% | 8.3% [9.4%] | 13.9% |
| 2006 | 9,466 | 80 | 0.8% | 6.3% [10.1%] | 10.5% |
| 2007 | 10,913 | 133 | 1.2% | 8.3% [9.5%] | 13.5% |
| 2008 | 10,537 | 122 | 1.2% | 13.9% [10.0%] | 15.2% |
| 2009 | 10,592 | 138 | 1.3% | 8.0% [10.3%] | 17.1% |
In 2004 the majority of these trainers used tongue ties on odd occasions for individual horses. The notable exceptions were :-
The following table shows the top eight most used courses for
debut runs for the seasons 2003, 2004 and 2005. Note that 'Newmarket' is
the total for both the Rowley and July courses for the 2003 and 2004 seasons.
| 2003 | 2004 | 2005 | |||||||||
| Course | Number of Debuts | % wins to runs on deb | Course | Number of Debuts | % wins to runs on deb | Course | Number of Debuts | % wins to runs on deb | |||
| 1st | Newmarket | 304 | 7.2% | Newmarket | 343 | 6.7% | Newbury | 234 | 6.0% | ||
| 2nd | Windsor | 182 | 1.6% | Windsor | 169 | 5.9% | Newmarket July | 197 | 6.6% | ||
| 3rd | Newbury | 170 | 5.9% | Newbury | 156 | 5.8% | Newmarket Rowley | 187 | 5.9% | ||
| 4th | Doncaster | 131 | 5.3% | Lingfield AW | 144 | 4.2% | Windsor | 173 | 2.9% | ||
| 5th | Nottingham | 127 | 3.1% | Kempton | 127 | 7.1% | Lingfield AW | 142 | 6.3% | ||
| 6th | Leicester | 109 | 11.1% | Doncaster | 116 | 6.9% | Leicester | 139 | 4.3% | ||
| 7th | Lingfield AW | 102 | 5.9% | York | 111 | 8.1% | Nottingham | 130 | 7.7% | ||
| 8th | Salisbury | 94 | 7.4% | Yarmouth | 110 | 6.4% | Doncaster | 128 | 4.7% |
The following table shows the eight least used courses for debut
runs during 2003, 2004 and 2005.
| 2003 | 2004 | 2005 | |||||||||
| Course | Number of Debuts | % wins to runs on deb | Course | Number of Debuts | % wins to runs on deb | Course | Number of Debuts | % wins to runs on deb | |||
| 29th | Folkestone | 35 | 11.4% | Musselburgh | 35 | 8.6% | Musselburgh | 35 | 17.1% | ||
| 30th | Ascot | 30 | 16.7% | Hamilton | 33 | 12.1% | Chepstow | 33 | 6.1% | ||
| 31st | Musselburgh | 30 | 10% | Ascot | 29 | 9.7% | Ayr | 31 | 6.4% | ||
| 32nd | Catterick | 26 | 0% | Catterick | 27 | 3.7% | Southwell | 29 | 6.9% | ||
| 33rd | Carlisle | 20 | 5% | Carlisle | 27 | 11.1% | Brighton | 27 | 3.7% | ||
| 34th | Brighton | 20 | 10% | Brighton | 19 | 5.3% | Kempton | 19 | 10.5% | ||
| 35th | Chester | 16 | 0% | Chester | 17 | 0% | Chester | 19 | 0% | ||
| 36th | Epsom | 9 | 11.1% | Epsom | 9 | 11.1% | Epsom | 11 | 9.1% |
In 2006 the notes (b) & (c) proved to have predictive uses with the 16 debut runners at Chester managing a single placed run (an uncompetitive third). The only debut winner out of the four first time out runners at Epsom was Five A Side (at 10/1) for M. Johnston.
The Table below gives the 3,014 debut runs in 2007
broken down by the British racecourses and in descending order of total
debut runs. Note that Newmarket has two courses which are the 'Rowley Course'
used in Spring & Autumn and the 'July Course' used through the summer
from early July (i.e. not just in the month of July).
| Course | Number of
Debuts |
% of Total
Debuts |
Debut Wins | Debut
Win % |
| Newmarket
Rowley |
189 | 6.3 | 12 | 6.3 |
| Newmarket
July |
179 | 5.9 | 11 | 6.1 |
| Newbury | 175 | 5.8 | 13 | 7.4 |
| Windsor | 163 | 5.4 | 9 | 5.5 |
| Kempton AW | 152 | 5.0 | 8 | 5.3 |
| Lingfield AW | 148 | 4.9 | 16 | 10.8 |
| Haydock | 115 | 3.8 | 8 | 7.0 |
| Leicester | 113 | 3.7 | 8 | 7.1 |
| Nottingham | 112 | 3.7 | 12 | 10.7 |
| Salisbury | 108 | 3.6 | 6 | 5.6 |
| Yarmouth | 106 | 3.5 | 5 | 4.7 |
| Goodwood | 105 | 3.5 | 3 | 2.9 |
| Wolverhampton AW | 104 | 3.5 | 7 | 6.7 |
| Sandown | 93 | 3.1 | 3 | 3.2 |
| Newcastle | 91 | 3.0 | 7 | 7.7 |
| Bath | 83 | 2.8 | 4 | 4.8 |
| Thirsk | 76 | 2.5 | 5 | 6.6 |
| Redcar | 75 | 2.5 | 7 | 9.3 |
| Warwick | 74 | 2.5 | 7 | 9.5 |
| Folkestone | 73 | 2.4 | 6 | 8.2 |
| Pontefract | 65 | 2.2 | 4 | 6.2 |
| Ascot | 65 | 2.2 | 4 | 6.2 |
| Ripon | 63 | 2.1 | 7 | 11.1 |
| York | 60 | 2.0 | 4 | 6.7 |
| Beverley | 58 | 1.9 | 3 | 5.2 |
| Lingfield
Turf |
49 | 1.6 | 2 | 4.1 |
| Doncaster* | 48 | 1.6 | 3 | 6.3 |
| Catterick | 47 | 1.6 | 4 | 8.5 |
| Ayr | 44 | 1.5 | 3 | 6.8 |
| Chepstow | 32 | 1.1 | 2 | 6.3 |
| Southwell AW* | 31 | 1.0 | 2 | 6.5 |
| Hamilton | 30 | 1.0 | 4 | 13.3 |
| Carlisle | 29 | 1.0 | 3 | 10.3 |
| Musselburgh | 28 | 0.9 | 3 | 10.7 |
| Chester | 16 | 0.5 | 0 | 0 |
| Brighton | 14 | 0.5 | 2 | 14.3 |
| Epsom* | 1 | 0 | 0 | 0 |
| Season | Total Declarations | Total Runners | Total of Non-runners and Withdrawals | Total of Non-runners | Total Withdrawals |
| 2004 | 11,065 | 10,567 (95.5%) | 498 (4.5%) | ||
| 2005 | 11,181 | 10,601 (94.8%) | 580 (5.2%) | 443 | 137 |
| 2006 | 10,135 | 9,466 (93.4%) | 669 (6.6%) | 618 | 51 |
| 2007 | 11,885 | 10,913 (91.8%) | 972 (8.2%) | 912 | 60 |
Therefore in the 2004 & 2005 seasons there were between 4.5 to 5.2% of declared horses which did not particpate for some reason. A horse classified as a non-runner (NR) was not declared as ready to run at the course on the day of the meeting. This usually means they have been diagnosed as not fit to run and will not have travelled to the course. A withdrawn (WD) horse will have made it to the course on the day and been declared ready to run. Some problem between saddling for the race and the start will then cause a withdrawal, for example, bolting on the way to post or refusing to be loaded into the stalls.
The Table below summarises the trainers who had more than 50 declarations
to run during the season but had percentages of non-participants above
8% compared to the overall 4.5 to 5.2% average range.
| 2004 | Season | 2005 | Season | |||||
| Trainer | Number of Declarations | Total of NRs & WDs | % of NRs & WDs | Trainer | Number of Declarations | Total of NRs & WDs | % of NRs & WDs | |
| A Bailey | 63 | 9 | 14.3% | S Kirk | 115 | 22 | 19.1% | |
| J Weymes | 62 | 7 | 11.3% | B Palling | 54 | 8 | 14.8% | |
| JS Moore | 87 | 9 | 10.3% | W Haggas | 90 | 9 | 10.0% | |
| A Duffield | 59 | 6 | 10.2% | M Wallace | 76 | 7 | 9.2% | |
| C Dwyer | 50 | 5 | 10.0% | MW Easterby | 132 | 12 | 9.1% | |
| M Wallace | 76 | 7 | 9.2% | P Cole | 99 | 9 | 9.1% | |
| N Littmoden | 103 | 9 | 8.7% | N Littmoden | 80 | 7 | 8.8% | |
| P Blockley | 72 | 6 | 8.3% | WR Muir | 74 | 6 | 8.1% | |
| J Ramsden | 73 | 6 | 8.2% | E Dunlop | 111 | 9 | 8.1% | |
| S Kirk | 122 | 10 | 8.2% | |||||
| J Noseda | 62 | 5 | 8.1% |
| 2006 | Season | 2007 | Season | |||||
| Trainer | Number of Declarations | Total of NRs & WDs | % of NRs & WDs | Trainer | Number of Declarations | Total of NRs & WDs | % of NRs & WDs | |
| A. Duffield | 93 | 13 | 14.0% | JR Weymes | 58 | 10 | 17.2% | |
| EJ O'Neill | 130 | 18 | 13.8% | MJ Wallace | 94 | 16 | 17.0% | |
| P. Blockley | 64 | 8 | 12.5% | SB Suroor | 67 | 9 | 13.4% | |
| WJ Knight | 64 | 8 | 12.5% | JJ Quinn | 70 | 9 | 12.9% | |
| MDI Usher | 60 | 7 | 11.7% | R Hannon | 542 | 66 | 12.2% | |
| A. Berry | 62 | 7 | 11.3% | A Berry | 93 | 11 | 11.8% | |
| B. Smart | 107 | 12 | 11.2% | GA Swinbank | 70 | 8 | 11.4% | |
| S. Kirk | 81 | 9 | 11.1% | A Duffield | 98 | 11 | 11.2% | |
| NA Callaghan | 100 | 11 | 11.0% | TD Barron | 73 | 8 | 11.0% | |
| JHM Gosden | 86 | 9 | 10.5% | R Charlton | 104 | 11 | 10.6% | |
| N. Littmoden | 51 | 5 | 9.8% | BJ Meehan | 306 | 32 | 10.5% | |
| CG Cox | 73 | 7 | 9.6% | N Tinkler | 67 | 7 | 10.4% | |
| KR Burke | 171 | 16 | 9.4% | KR Burke | 155 | 16 | 10.3% | |
| MJ Wallace | 69 | 6 | 8.7% | NA Callaghan | 78 | 8 | 10.3% | |
| WGM Turner | 116 | 10 | 8.6% | EJ O'Neill | 90 | 0 | 10.0% | |
| IA Wood | 70 | 6 | 8.6% | M Brittain | 121 | 12 | 9.9% | |
| BJ Meehan | 286 | 24 | 8.4% | WR Muir | 102 | 10 | 9.8% | |
| R. Hannon | 468 | 39 | 8.3% |
© British 2yo Racing. All rights reserved.